Estimated Value: $412,640 - $473,000
1
Bed
2
Baths
1,288
Sq Ft
$342/Sq Ft
Est. Value
About This Home
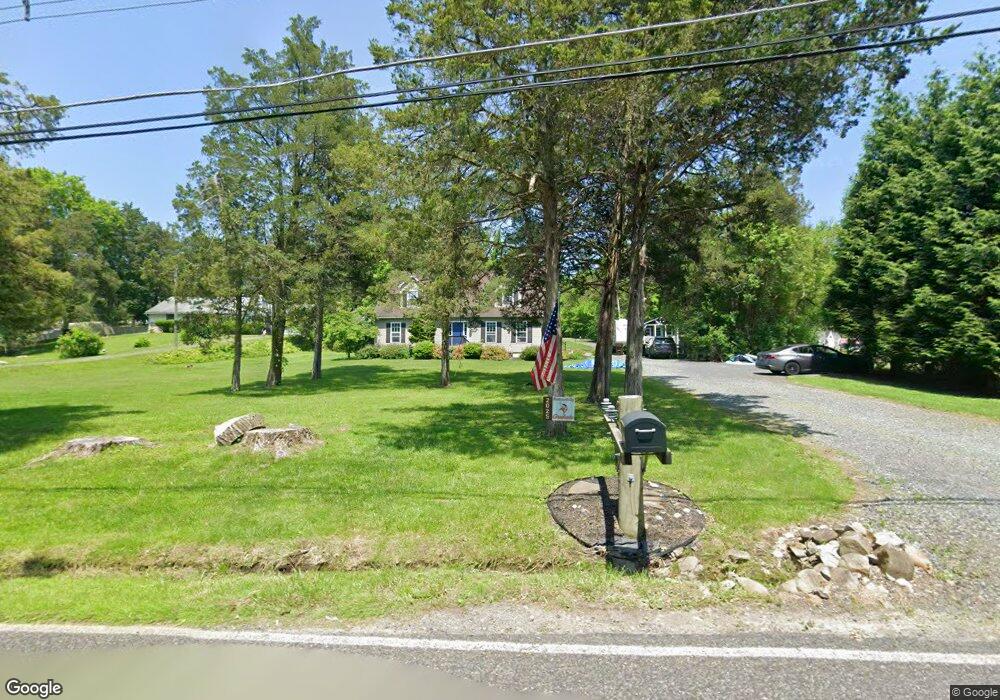
This home is located at 5 Cepp Rd, Perkiomenville, PA 18074 and is currently estimated at $440,160, approximately $341 per square foot. 5 Cepp Rd is a home located in Montgomery County with nearby schools including Schwenksville Elementary School, Perkiomen Valley Middle School West, and Saint Mary Catholic School.
Ownership History
Date
Name
Owned For
Owner Type
Purchase Details
Closed on
Nov 12, 2015
Sold by
Mann Alan Richard
Bought by
Shilling Fred and Mann Kristin Beth
Current Estimated Value
Home Financials for this Owner
Home Financials are based on the most recent Mortgage that was taken out on this home.
Original Mortgage
$189,000
Outstanding Balance
$149,060
Interest Rate
3.87%
Mortgage Type
New Conventional
Estimated Equity
$291,100
Purchase Details
Closed on
Dec 1, 2014
Sold by
Mann Alan R and Mann Kristin B
Bought by
Mann Alan R
Home Financials for this Owner
Home Financials are based on the most recent Mortgage that was taken out on this home.
Original Mortgage
$239,000
Interest Rate
3.37%
Mortgage Type
Adjustable Rate Mortgage/ARM
Purchase Details
Closed on
Jul 9, 2003
Sold by
Mann Alan R
Bought by
Mann Alan R and Mann Kristin B
Purchase Details
Closed on
Jun 28, 2000
Sold by
Cessna Ronald and Cessna Diane K
Bought by
Mann Alan R
Create a Home Valuation Report for This Property
The Home Valuation Report is an in-depth analysis detailing your home's value as well as a comparison with similar homes in the area
Home Values in the Area
Average Home Value in this Area
Purchase History
| Date | Buyer | Sale Price | Title Company |
|---|---|---|---|
| Shilling Fred | -- | None Available | |
| Mann Alan R | -- | None Available | |
| Mann Alan R | -- | -- | |
| Mann Alan R | $89,900 | -- |
Source: Public Records
Mortgage History
| Date | Status | Borrower | Loan Amount |
|---|---|---|---|
| Open | Shilling Fred | $189,000 | |
| Closed | Mann Alan R | $239,000 |
Source: Public Records
Tax History Compared to Growth
Tax History
| Year | Tax Paid | Tax Assessment Tax Assessment Total Assessment is a certain percentage of the fair market value that is determined by local assessors to be the total taxable value of land and additions on the property. | Land | Improvement |
|---|---|---|---|---|
| 2025 | $5,987 | $134,900 | $45,760 | $89,140 |
| 2024 | $5,987 | $134,900 | $45,760 | $89,140 |
| 2023 | $5,787 | $134,900 | $45,760 | $89,140 |
| 2022 | $5,664 | $134,900 | $45,760 | $89,140 |
| 2021 | $5,578 | $134,900 | $45,760 | $89,140 |
| 2020 | $5,394 | $134,900 | $45,760 | $89,140 |
| 2019 | $5,328 | $134,900 | $45,760 | $89,140 |
| 2018 | $5,329 | $134,900 | $45,760 | $89,140 |
| 2017 | $5,099 | $134,900 | $45,760 | $89,140 |
| 2016 | $5,047 | $134,900 | $45,760 | $89,140 |
| 2015 | $4,881 | $134,900 | $45,760 | $89,140 |
| 2014 | $4,791 | $134,900 | $45,760 | $89,140 |
Source: Public Records
Map
Nearby Homes
- 27 Cepp Rd
- Dalton w/ Basement & Sun Room Plan at Farm View
- Grayson w/ Basement Plan at Farm View
- Graham w/ Basement Plan at Farm View
- Grayson w/ Basement & Sun Room Plan at Farm View
- Dalton w/ Basement Plan at Farm View
- Graham w/ Basement & Sun Room Plan at Farm View
- 102 Steiner Way
- 21 Big Rd
- 3332 Big Rd
- 133 Bavington Rd
- 15 Gerloff Rd
- 71 Aspen Way
- 5 Mary Jane St
- 1160 Pin Oak Dr
- 1225 Pin Oak Dr
- 2 Meng Rd
- 1715 Gravel Pike
- 673 Spring Mount Rd
- 808 Mountainview Ave
- 7 Cepp Rd
- 11 Cepp Rd
- 15 Cepp Rd
- 1 Cepp Rd
- 8 Cepp Rd
- 204 Salford Station Rd
- 206 Salford Station Rd
- 17 Cepp Rd
- 208 Salford Station Rd
- 203 Salford Station Rd
- 105 Salford Station Rd
- 0 Cepp Rd Unit 1002144190
- 205 Salford Station Rd
- 103 Salford Station Rd
- 000 Cepp Rd
- 00 Cepp Rd
- 207 Salford Station Rd
- 19 Cepp Rd
- 212 Salford Station Rd