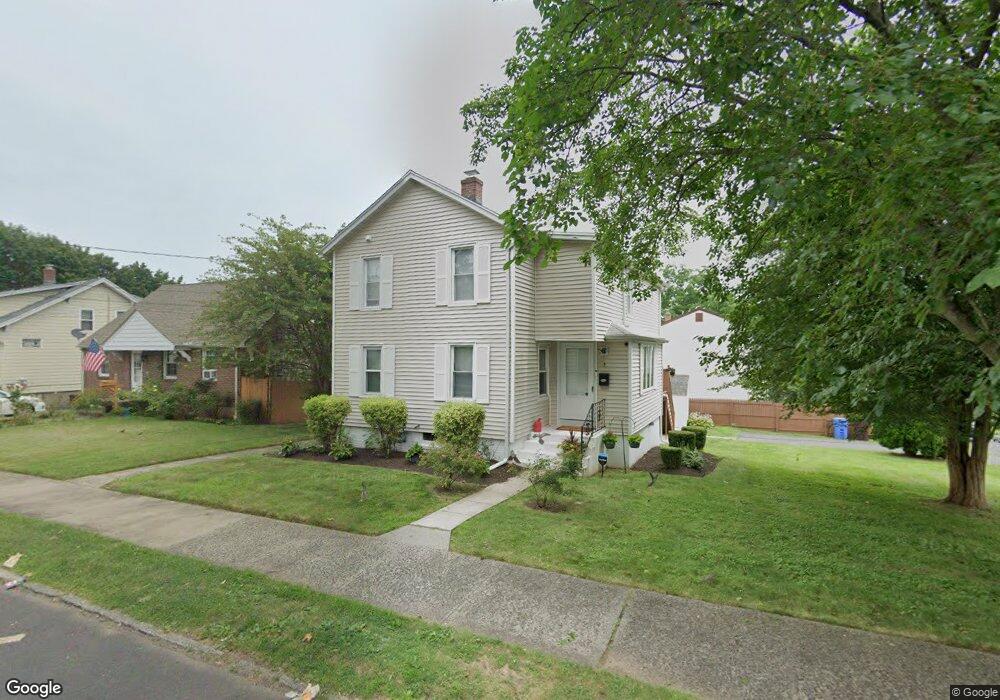
5 Chapman St New Britain, CT 06051
Estimated Value: $244,000 - $292,000
5
Beds
2
Baths
1,544
Sq Ft
$176/Sq Ft
Est. Value
About This Home
This home is located at 5 Chapman St, New Britain, CT 06051 and is currently estimated at $272,428, approximately $176 per square foot. 5 Chapman St is a home located in Hartford County with nearby schools including Slade Middle School, Emmanuel Christian Academy, and Mountain Laurel Sudbury School.
Ownership History
Date
Name
Owned For
Owner Type
Purchase Details
Closed on
Feb 16, 2012
Sold by
Polikowski Jorge
Bought by
Collier Donna
Current Estimated Value
Purchase Details
Closed on
Jul 15, 2011
Sold by
Department Of Housing & Urban Dev
Bought by
Polikowski Jorge
Purchase Details
Closed on
Mar 19, 2001
Sold by
Leiner Lorraine E
Bought by
Ruiz-Romero Quecy
Purchase Details
Closed on
Oct 30, 1997
Sold by
Leiner Helen L
Bought by
Leiner Lorraine E
Create a Home Valuation Report for This Property
The Home Valuation Report is an in-depth analysis detailing your home's value as well as a comparison with similar homes in the area
Home Values in the Area
Average Home Value in this Area
Purchase History
| Date | Buyer | Sale Price | Title Company |
|---|---|---|---|
| Collier Donna | $147,800 | -- | |
| Polikowski Jorge | $47,000 | -- | |
| Ruiz-Romero Quecy | $70,000 | -- | |
| Leiner Lorraine E | $60,000 | -- |
Source: Public Records
Mortgage History
| Date | Status | Borrower | Loan Amount |
|---|---|---|---|
| Open | Leiner Lorraine E | $95,000 | |
| Closed | Leiner Lorraine E | $72,550 | |
| Closed | Leiner Lorraine E | $50,300 |
Source: Public Records
Tax History Compared to Growth
Tax History
| Year | Tax Paid | Tax Assessment Tax Assessment Total Assessment is a certain percentage of the fair market value that is determined by local assessors to be the total taxable value of land and additions on the property. | Land | Improvement |
|---|---|---|---|---|
| 2025 | $5,315 | $135,660 | $42,840 | $92,820 |
| 2024 | $5,371 | $135,660 | $42,840 | $92,820 |
| 2023 | $5,193 | $135,660 | $42,840 | $92,820 |
| 2022 | $4,491 | $90,720 | $19,740 | $70,980 |
| 2021 | $4,491 | $90,720 | $19,740 | $70,980 |
| 2020 | $4,581 | $90,720 | $19,740 | $70,980 |
| 2019 | $4,581 | $90,720 | $19,740 | $70,980 |
| 2018 | $4,581 | $90,720 | $19,740 | $70,980 |
| 2017 | $4,207 | $83,300 | $19,740 | $63,560 |
| 2016 | $4,207 | $83,300 | $19,740 | $63,560 |
| 2015 | $4,082 | $83,300 | $19,740 | $63,560 |
| 2014 | $4,082 | $83,300 | $19,740 | $63,560 |
Source: Public Records
Map
Nearby Homes