Estimated Value: $960,000 - $1,229,000
3
Beds
3
Baths
1,750
Sq Ft
$623/Sq Ft
Est. Value
About This Home
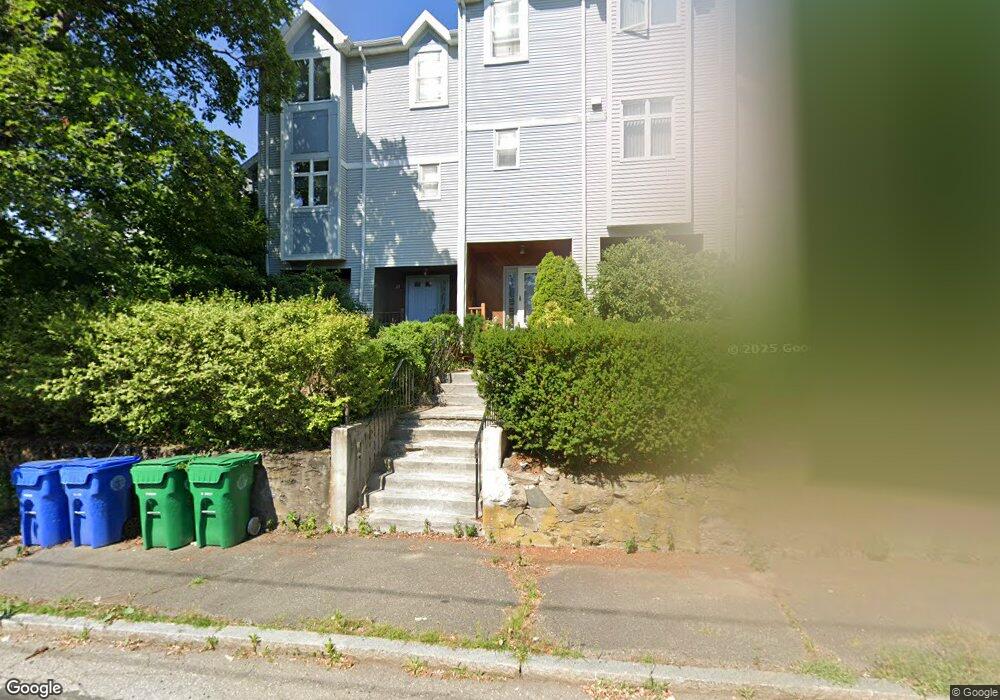
This home is located at 5 Cheney St, Newton Upper Falls, MA 02464 and is currently estimated at $1,089,492, approximately $622 per square foot. 5 Cheney St is a home located in Middlesex County with nearby schools including Countryside Elementary School, Charles E Brown Middle School, and Newton South High School.
Ownership History
Date
Name
Owned For
Owner Type
Purchase Details
Closed on
Nov 23, 2010
Sold by
Varney Elizabeth A
Bought by
Guo Jianlin and Luo Xiang L
Current Estimated Value
Home Financials for this Owner
Home Financials are based on the most recent Mortgage that was taken out on this home.
Original Mortgage
$305,000
Outstanding Balance
$201,542
Interest Rate
4.3%
Mortgage Type
Purchase Money Mortgage
Estimated Equity
$887,950
Purchase Details
Closed on
May 12, 2005
Sold by
Priborkin Grigoriy and Priborkin Larisa
Bought by
Varney Elizabeth A
Home Financials for this Owner
Home Financials are based on the most recent Mortgage that was taken out on this home.
Original Mortgage
$290,000
Interest Rate
6.05%
Mortgage Type
Purchase Money Mortgage
Purchase Details
Closed on
Jan 31, 1997
Sold by
Upper Falls Nt
Bought by
Priborkin Grigoriy and Priborkin Larisa
Home Financials for this Owner
Home Financials are based on the most recent Mortgage that was taken out on this home.
Original Mortgage
$237,150
Interest Rate
7.65%
Mortgage Type
Purchase Money Mortgage
Create a Home Valuation Report for This Property
The Home Valuation Report is an in-depth analysis detailing your home's value as well as a comparison with similar homes in the area
Home Values in the Area
Average Home Value in this Area
Purchase History
| Date | Buyer | Sale Price | Title Company |
|---|---|---|---|
| Guo Jianlin | $505,000 | -- | |
| Varney Elizabeth A | $590,000 | -- | |
| Priborkin Grigoriy | $263,500 | -- |
Source: Public Records
Mortgage History
| Date | Status | Borrower | Loan Amount |
|---|---|---|---|
| Open | Guo Jianlin | $305,000 | |
| Previous Owner | Priborkin Grigoriy | $100,000 | |
| Previous Owner | Priborkin Grigoriy | $300,000 | |
| Previous Owner | Varney Elizabeth A | $290,000 | |
| Previous Owner | Priborkin Grigoriy | $227,000 | |
| Previous Owner | Priborkin Grigoriy | $237,150 |
Source: Public Records
Tax History Compared to Growth
Tax History
| Year | Tax Paid | Tax Assessment Tax Assessment Total Assessment is a certain percentage of the fair market value that is determined by local assessors to be the total taxable value of land and additions on the property. | Land | Improvement |
|---|---|---|---|---|
| 2025 | $8,320 | $849,000 | $0 | $849,000 |
| 2024 | $8,045 | $824,300 | $0 | $824,300 |
| 2023 | $7,864 | $772,500 | $0 | $772,500 |
| 2022 | $7,740 | $735,700 | $0 | $735,700 |
| 2021 | $7,469 | $694,100 | $0 | $694,100 |
| 2020 | $7,246 | $694,100 | $0 | $694,100 |
| 2019 | $7,042 | $673,900 | $0 | $673,900 |
| 2018 | $7,039 | $650,600 | $0 | $650,600 |
| 2017 | $6,825 | $613,800 | $0 | $613,800 |
| 2016 | $6,528 | $573,600 | $0 | $573,600 |
| 2015 | $6,343 | $546,300 | $0 | $546,300 |
Source: Public Records
Map
Nearby Homes
- 66 Linden St
- 12 Shawmut Park
- 20 Pennsylvania Ave
- 20 Pennsylvania Ave Unit 20
- 18-20 Pennsylvania Ave Unit 18
- 300 Elliot St Unit 300
- 302 Elliot St Carriage House N Unit 3
- 304 Elliot St Carriage House S Unit 4
- 27 Indiana Terrace Unit 29
- 102 Thurston Rd Unit 100
- 51 Pettee St Unit 11
- 183 Oak St Unit 307
- 183 Oak St Unit 205
- 103 Thurston Rd
- 54 Indiana Terrace
- 1 Williams Ct
- 66 Rockland Place
- 17 Circuit Ave Unit 2
- 128 Charlemont St
- 45 River Ave Unit 45
- 29 Mechanic St
- 23 Mechanic St
- 5 Cheney St Unit 5
- 5 Cheney St Unit 29
- 29 Mechanic St Unit 3
- 29 Mechanic St Unit 29/29
- 3 Cheney St
- 7 Cheney Ct
- 15 Cheney Ct
- 8 Cheney Ct
- 45 Mechanic St Unit 47
- 45 Mechanic St Unit 1
- 45 Mechanic St Unit 3
- 14 Cheney Ct
- 19 Cheney St Unit 21
- 32 Mechanic St Unit 34
- 38 Mechanic St Unit 1
- 38 Mechanic St
- 38 Mechanic St Unit 2
- 32-34 Mechanic St