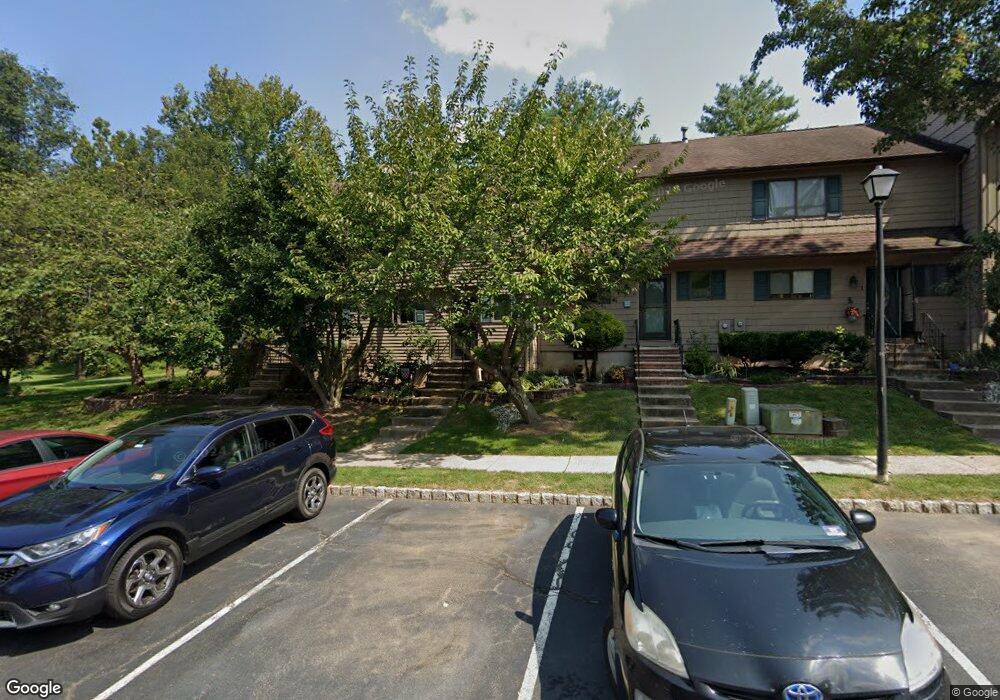
5 Chestnut Ct High Bridge, NJ 08829
Estimated Value: $312,000 - $343,797
Studio
--
Bath
1,305
Sq Ft
$247/Sq Ft
Est. Value
About This Home
This home is located at 5 Chestnut Ct, High Bridge, NJ 08829 and is currently estimated at $322,949, approximately $247 per square foot. 5 Chestnut Ct is a home located in Hunterdon County with nearby schools including High Bridge Elementary School, High Bridge Middle School, and Voorhees High School.
Ownership History
Date
Name
Owned For
Owner Type
Purchase Details
Closed on
Jan 23, 2003
Sold by
Defederico David A
Bought by
Lukacs Patricia A
Current Estimated Value
Home Financials for this Owner
Home Financials are based on the most recent Mortgage that was taken out on this home.
Original Mortgage
$132,000
Outstanding Balance
$55,738
Interest Rate
5.88%
Estimated Equity
$267,211
Purchase Details
Closed on
Apr 28, 2000
Sold by
Muldowney Robert J
Bought by
Defederico David A and Defederico Jill C
Home Financials for this Owner
Home Financials are based on the most recent Mortgage that was taken out on this home.
Original Mortgage
$71,050
Interest Rate
8.21%
Purchase Details
Closed on
Jul 14, 1989
Sold by
Hughes Peter A and Hughes Kathleen S
Bought by
Muldowney Robert J and Muldowney Lisa A
Create a Home Valuation Report for This Property
The Home Valuation Report is an in-depth analysis detailing your home's value as well as a comparison with similar homes in the area
Home Values in the Area
Average Home Value in this Area
Purchase History
| Date | Buyer | Sale Price | Title Company |
|---|---|---|---|
| Lukacs Patricia A | $165,000 | -- | |
| Defederico David A | $101,500 | -- | |
| Muldowney Robert J | $114,000 | -- |
Source: Public Records
Mortgage History
| Date | Status | Borrower | Loan Amount |
|---|---|---|---|
| Open | Lukacs Patricia A | $132,000 | |
| Previous Owner | Defederico David A | $71,050 |
Source: Public Records
Tax History
| Year | Tax Paid | Tax Assessment Tax Assessment Total Assessment is a certain percentage of the fair market value that is determined by local assessors to be the total taxable value of land and additions on the property. | Land | Improvement |
|---|---|---|---|---|
| 2025 | $8,349 | $277,700 | $115,800 | $161,900 |
| 2024 | $7,948 | $255,800 | $71,400 | $184,400 |
| 2023 | $7,948 | $201,000 | $66,000 | $135,000 |
| 2022 | $6,991 | $164,300 | $56,000 | $108,300 |
| 2021 | $6,692 | $164,300 | $56,000 | $108,300 |
| 2020 | $6,724 | $164,000 | $55,100 | $108,900 |
| 2019 | $6,692 | $162,000 | $52,500 | $109,500 |
| 2018 | $6,349 | $160,200 | $50,000 | $110,200 |
| 2017 | $6,247 | $162,100 | $50,000 | $112,100 |
| 2016 | $6,174 | $162,100 | $50,000 | $112,100 |
| 2015 | $6,007 | $162,100 | $50,000 | $112,100 |
| 2014 | $6,107 | $178,100 | $85,000 | $93,100 |
Source: Public Records
Map
Nearby Homes
- 6 Chestnut Ct
- 4 Chestnut Ct
- 2 Chestnut Ct
- 1 Chestnut Ct
- 7 Chestnut Ct
- 8 Chestnut Ct
- 9 Chestnut Ct
- 10 Chestnut Ct
- 11 Chestnut Ct
- 1 Indian Spring Ln
- 2 Indian Spring Ln
- 3 Indian Spring Ln
- 4 Indian Spring Ln
- 12 Chestnut Ct
- 32 Chestnut Ct
- 15 Chestnut Ct
- 31 Chestnut Ct
- 14 Chestnut Ct
- 16 Chestnut Ct
- 17 Chestnut Ct
Your Personal Tour Guide
Ask me questions while you tour the home.