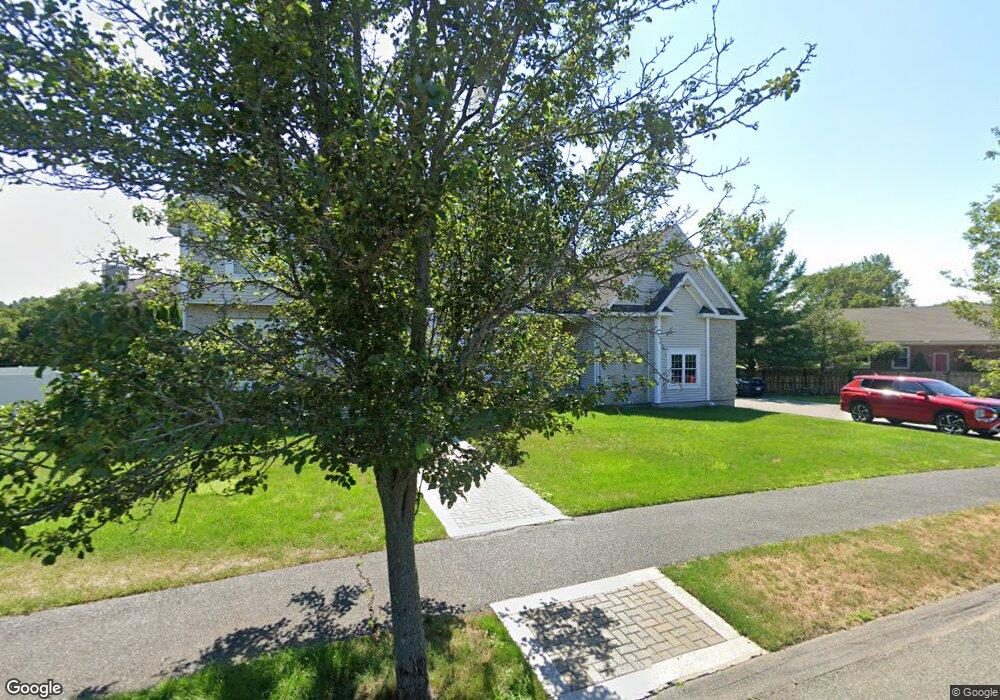
5 Christian Ln Danvers, MA 01923
Estimated Value: $1,148,000 - $1,491,000
5
Beds
4
Baths
3,600
Sq Ft
$353/Sq Ft
Est. Value
About This Home
This home is located at 5 Christian Ln, Danvers, MA 01923 and is currently estimated at $1,271,059, approximately $353 per square foot. 5 Christian Ln is a home located in Essex County with nearby schools including Danvers High School, St. Mary of the Annunciation School, and Plumfield Academy.
Ownership History
Date
Name
Owned For
Owner Type
Purchase Details
Closed on
Dec 1, 2004
Sold by
Dawson Jerry A
Bought by
Dekermanji Maria
Current Estimated Value
Home Financials for this Owner
Home Financials are based on the most recent Mortgage that was taken out on this home.
Original Mortgage
$598,500
Outstanding Balance
$298,931
Interest Rate
5.69%
Mortgage Type
Purchase Money Mortgage
Estimated Equity
$972,128
Create a Home Valuation Report for This Property
The Home Valuation Report is an in-depth analysis detailing your home's value as well as a comparison with similar homes in the area
Home Values in the Area
Average Home Value in this Area
Purchase History
We collect this data history from publicly available records. To have your information removed, we recommend requesting removal directly through your county’s website.
| Date | Buyer | Sale Price | Title Company |
|---|---|---|---|
| Dekermanji Maria | $798,000 | -- |
Source: Public Records
Mortgage History
We collect this data history from publicly available records. To have your information removed, we recommend requesting removal directly through your county’s website.
| Date | Status | Borrower | Loan Amount |
|---|---|---|---|
| Open | Dekermanji Maria | $598,500 | |
| Closed | Dekermanji Maria | $151,500 | |
| Closed | Dekermanji Maria | $743,750 |
Source: Public Records
Tax History
| Year | Tax Paid | Tax Assessment Tax Assessment Total Assessment is a certain percentage of the fair market value that is determined by local assessors to be the total taxable value of land and additions on the property. | Land | Improvement |
|---|---|---|---|---|
| 2025 | $12,902 | $1,174,000 | $465,100 | $708,900 |
| 2024 | $12,609 | $1,134,900 | $465,100 | $669,800 |
| 2023 | $12,276 | $1,044,800 | $432,100 | $612,700 |
| 2022 | $11,950 | $943,900 | $375,100 | $568,800 |
| 2021 | $11,271 | $844,300 | $345,100 | $499,200 |
| 2020 | $10,734 | $821,900 | $322,600 | $499,300 |
| 2019 | $10,686 | $804,700 | $322,600 | $482,100 |
| 2018 | $10,395 | $767,700 | $319,600 | $448,100 |
| 2017 | $9,980 | $703,300 | $285,100 | $418,200 |
| 2016 | $9,828 | $692,100 | $285,100 | $407,000 |
| 2015 | $9,645 | $646,900 | $262,600 | $384,300 |
Source: Public Records
Map
Nearby Homes
- 360 Andover St Unit 1310
- 320 Newbury St Unit 902
- 98 Newbury St Unit 18B
- 98 Newbury St Unit 2B
- 98 Newbury St Unit 23B
- 103 Newbury St Unit 1
- 96 Newbury St Unit 10B
- 8 Edgewood Rd
- 77 Centre St
- 65 Locust St
- 40 Village Rd Unit 1006
- 38 Village Rd Unit 110
- 38 Village Rd Unit 515
- 36 Village Rd Unit 714
- 134 North St
- 200 North St
- 200 North St Unit 23-B
- 19 Devonshire Rd
- 15 Rowell Ln Unit 15
- 20 1/2 Webb St Unit 2A
Your Personal Tour Guide
Ask me questions while you tour the home.