5 Clarkson St Newton, NJ 07860
Estimated payment $565/month
About This Home
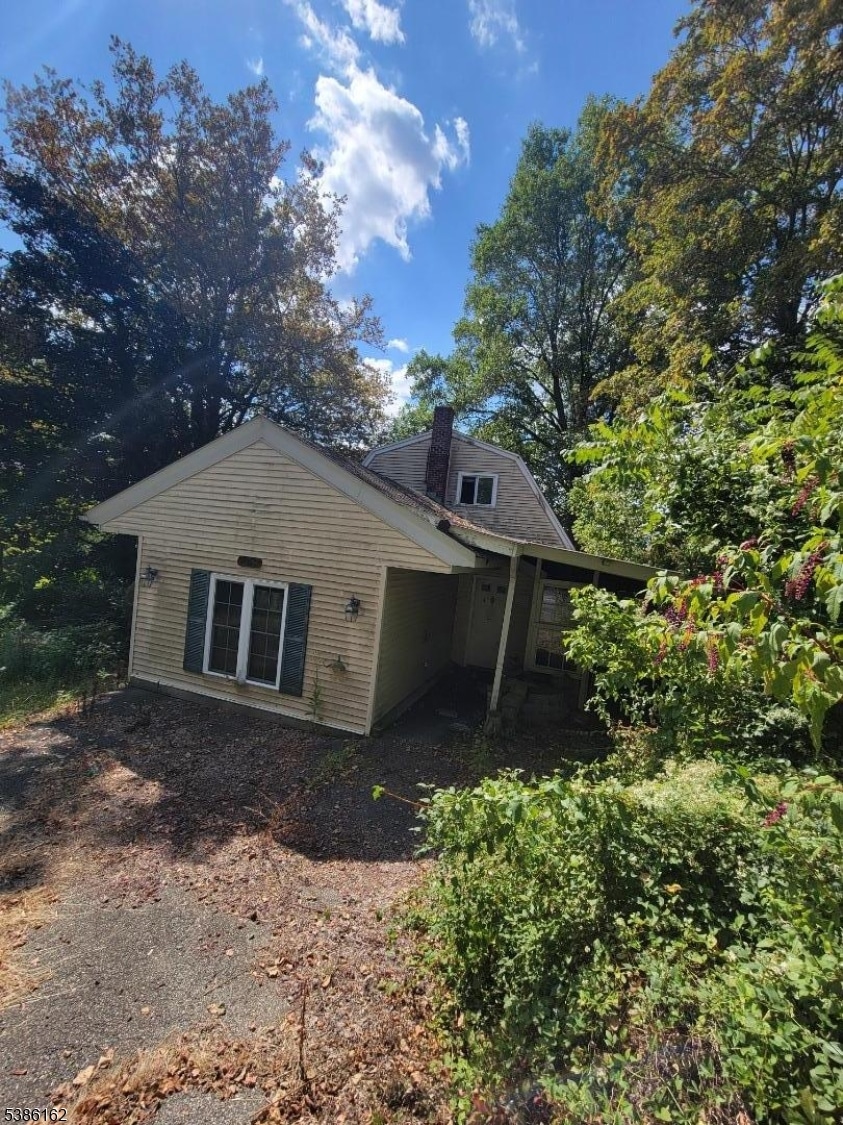
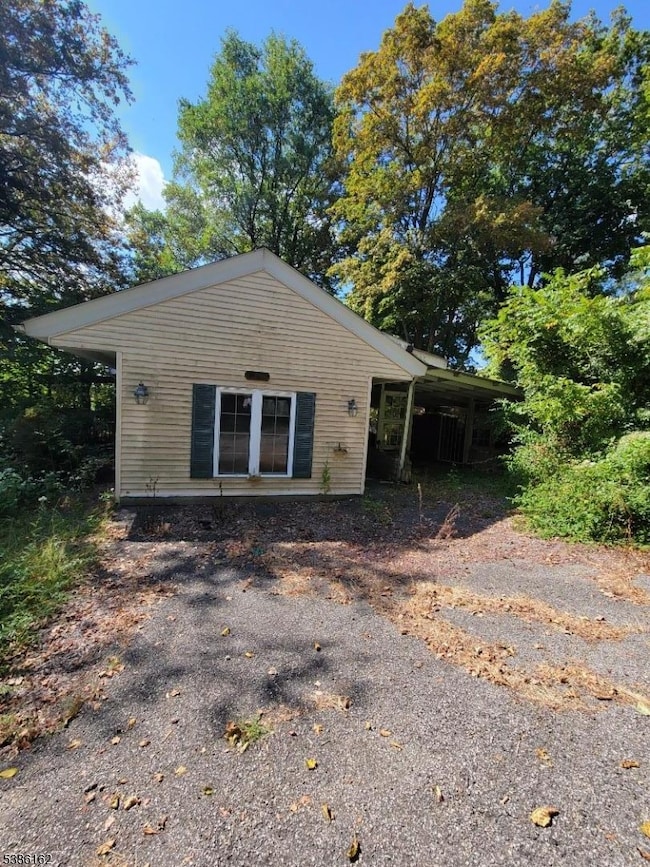
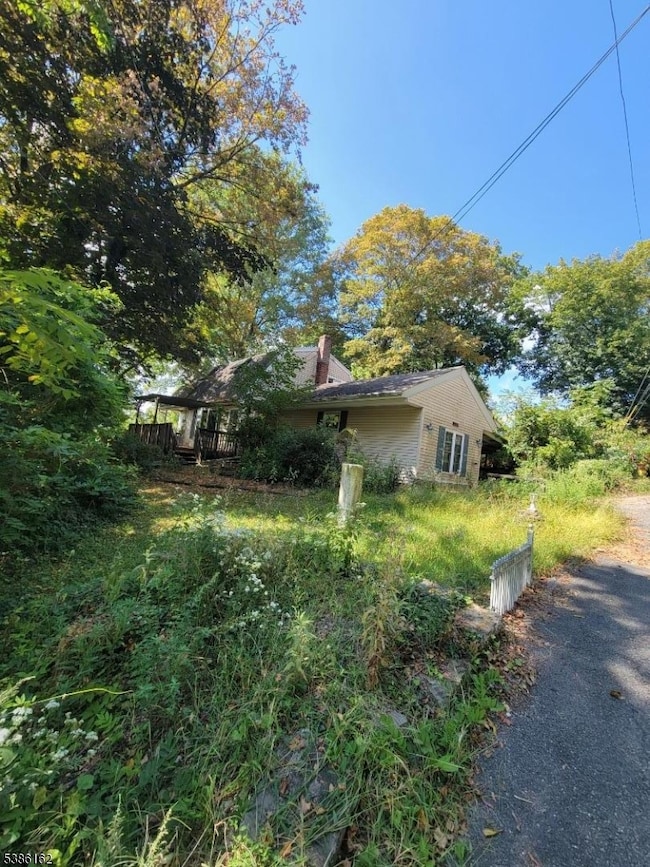
Welcome to Newton, NJ! A property with endless potential for the right buyer. This single-family home is in need of full renovation. Perfect for experienced investors, contractors, or visionaries looking for a full rehab project, this property offers the chance to rebuild and create value in a desirable Sussex County location. Close to local shops, schools, and major roadways, this is your opportunity to bring new life to a property with strong upside potential. Being sold strictly as-is with buyer responsible for all inspections, certifications, and approvals.
Home Details
Home Type
- Single Family
Year Built
- Built in 1953
Lot Details
- 0.53 Acre Lot
Parking
- Private Driveway
Home Design
- Cape Cod Architecture
Bedrooms and Bathrooms
- 2 Bedrooms
- 2 Full Bathrooms
Additional Features
- Unfinished Basement
Listing and Financial Details
- Assessor Parcel Number 2815-00007-0010-00012-0000-
Map
Home Values in the Area
Average Home Value in this Area
Tax History
| Year | Tax Paid | Tax Assessment Tax Assessment Total Assessment is a certain percentage of the fair market value that is determined by local assessors to be the total taxable value of land and additions on the property. | Land | Improvement |
|---|---|---|---|---|
| 2025 | $11,252 | $134,900 | $96,000 | $38,900 |
| 2024 | $12,053 | $412,600 | $81,600 | $331,000 |
| 2023 | $12,053 | $268,200 | $76,800 | $191,400 |
| 2022 | $12,101 | $268,200 | $76,800 | $191,400 |
| 2021 | $12,048 | $268,200 | $76,800 | $191,400 |
| 2020 | $11,862 | $268,200 | $76,800 | $191,400 |
| 2019 | $11,495 | $268,200 | $76,800 | $191,400 |
| 2018 | $11,433 | $268,200 | $76,800 | $191,400 |
| 2017 | $11,366 | $268,200 | $76,800 | $191,400 |
| 2016 | $11,184 | $268,200 | $76,800 | $191,400 |
| 2015 | $10,889 | $268,200 | $76,800 | $191,400 |
| 2014 | $10,664 | $268,200 | $76,800 | $191,400 |
Property History
| Date | Event | Price | List to Sale | Price per Sq Ft |
|---|---|---|---|---|
| 11/14/2025 11/14/25 | For Sale | $90,000 | 0.0% | -- |
| 10/14/2025 10/14/25 | Pending | -- | -- | -- |
| 09/19/2025 09/19/25 | For Sale | $90,000 | -- | -- |
Purchase History
| Date | Type | Sale Price | Title Company |
|---|---|---|---|
| Sheriffs Deed | $2,000 | None Listed On Document | |
| Interfamily Deed Transfer | -- | Or | |
| Interfamily Deed Transfer | -- | -- | |
| Interfamily Deed Transfer | -- | -- |
Mortgage History
| Date | Status | Loan Amount | Loan Type |
|---|---|---|---|
| Previous Owner | $397,500 | Reverse Mortgage Home Equity Conversion Mortgage |
Source: Garden State MLS
MLS Number: 3988056
APN: 15-00007-10-00012
Disclaimer: Certain information contained herein is derived from information provided by parties other than Homes.com. All information provided is deemed reliable, but is not guaranteed to be accurate and should be independently verified.
![]() The data relating to real estate for sale on this website comes in part from the IDX Program of Garden State Multiple Listing Service, L.L.C. Real estate listings held by other brokerage firms are marked as IDX Listing.
The data relating to real estate for sale on this website comes in part from the IDX Program of Garden State Multiple Listing Service, L.L.C. Real estate listings held by other brokerage firms are marked as IDX Listing.
Information deemed reliable but not guaranteed.
Copyright © 2025 Garden State Multiple Listing Service, L.L.C. All rights reserved.
Notice: The dissemination of listings on this website does not constitute the consent required by N.J.A.C. 11:5.6.1 (n) for the advertisement of listings exclusively for sale by another broker. Any such consent must be obtained in writing from the listing broker.
This information is being provided for Consumers’ personal, non-commercial use and may not be used for any purpose other than to identify prospective properties Consumers may be interested in purchasing.
- 14 W Nelson St
- 43 Madison St
- 9 Halsted St
- 70 W End Ave
- 24 Lawnwood Ave
- 59 High St Unit 9
- 59 High St
- 10 Summit Ave
- 18 Washington St Unit 2
- 7 Washington St
- 7 7 12washington St
- 8 Woodside Ave
- 188 Spring St Unit a
- 252 Spring St
- 223 Main St Unit 1
- 9 Moran St Unit 2
- 4 Harrison St Unit B
- 3 New Hampshire St Unit 2
- 71 Sparta Ave Unit 97
- 71 Sparta Ave Unit 300
