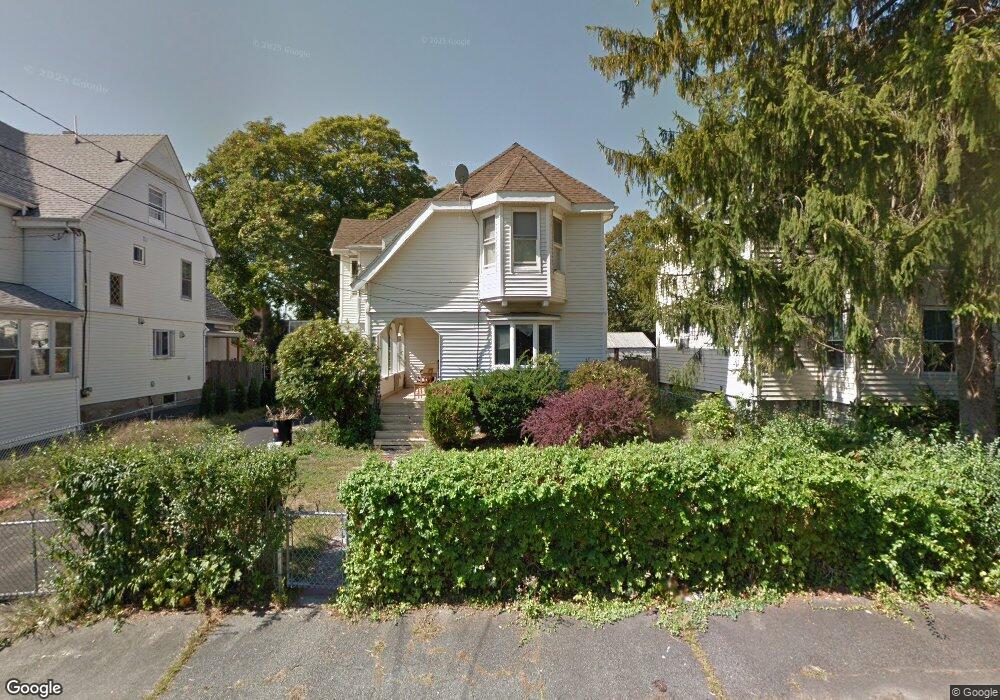
5 Clive St Quincy, MA 02171
North Quincy NeighborhoodEstimated Value: $767,534 - $937,000
4
Beds
2
Baths
1,650
Sq Ft
$518/Sq Ft
Est. Value
About This Home
This home is located at 5 Clive St, Quincy, MA 02171 and is currently estimated at $853,884, approximately $517 per square foot. 5 Clive St is a home located in Norfolk County with nearby schools including Francis W. Parker Elementary School, Atlantic Middle School, and North Quincy High School.
Ownership History
Date
Name
Owned For
Owner Type
Purchase Details
Closed on
Jun 16, 2006
Sold by
Le Chi T and Huynh David
Bought by
Yavuz Derya and Yavuz Sezar
Current Estimated Value
Home Financials for this Owner
Home Financials are based on the most recent Mortgage that was taken out on this home.
Original Mortgage
$332,000
Outstanding Balance
$195,734
Interest Rate
6.62%
Mortgage Type
Purchase Money Mortgage
Estimated Equity
$658,150
Purchase Details
Closed on
Mar 30, 2005
Sold by
Le Chi T and Huynh Thach N
Bought by
Le Chi T and Huynh David
Purchase Details
Closed on
Oct 2, 1996
Sold by
Warrick Rosalinda
Bought by
Huynh Tuan and Huynh Thach N
Home Financials for this Owner
Home Financials are based on the most recent Mortgage that was taken out on this home.
Original Mortgage
$98,700
Interest Rate
7.9%
Mortgage Type
Purchase Money Mortgage
Create a Home Valuation Report for This Property
The Home Valuation Report is an in-depth analysis detailing your home's value as well as a comparison with similar homes in the area
Home Values in the Area
Average Home Value in this Area
Purchase History
| Date | Buyer | Sale Price | Title Company |
|---|---|---|---|
| Yavuz Derya | $415,000 | -- | |
| Le Chi T | -- | -- | |
| Huynh Tuan | $141,000 | -- |
Source: Public Records
Mortgage History
| Date | Status | Borrower | Loan Amount |
|---|---|---|---|
| Open | Yavuz Derya | $332,000 | |
| Closed | Yavuz Derya | $83,000 | |
| Previous Owner | Huynh Tuan | $98,700 | |
| Previous Owner | Huynh Tuan | $60,000 | |
| Previous Owner | Huynh Tuan | $60,000 |
Source: Public Records
Tax History Compared to Growth
Tax History
| Year | Tax Paid | Tax Assessment Tax Assessment Total Assessment is a certain percentage of the fair market value that is determined by local assessors to be the total taxable value of land and additions on the property. | Land | Improvement |
|---|---|---|---|---|
| 2025 | $9,114 | $790,500 | $417,000 | $373,500 |
| 2024 | $8,507 | $754,800 | $417,000 | $337,800 |
| 2023 | $7,633 | $685,800 | $379,000 | $306,800 |
| 2022 | $7,328 | $611,700 | $303,200 | $308,500 |
| 2021 | $6,990 | $575,800 | $303,200 | $272,600 |
| 2020 | $6,904 | $555,400 | $297,300 | $258,100 |
| 2019 | $6,766 | $539,100 | $285,800 | $253,300 |
| 2018 | $6,675 | $500,400 | $272,200 | $228,200 |
| 2017 | $6,500 | $458,700 | $247,600 | $211,100 |
| 2016 | $6,033 | $420,100 | $225,000 | $195,100 |
| 2015 | $5,587 | $382,700 | $204,600 | $178,100 |
| 2014 | $5,448 | $366,600 | $204,600 | $162,000 |
Source: Public Records
Map
Nearby Homes
- 38 Walker St
- 201 Billings St
- 91 Atlantic St
- 85 E Squantum St Unit 10
- 175 Quincy Shore Dr Unit B24
- 68 Atlantic St
- 90 Shore Ave
- 90 Quincy Shore Dr Unit 701
- 90 Quincy Shore Dr Unit 501
- 138 Quincy Shore Dr Unit 170
- 148 Quincy Shore Dr Unit 43
- 58 Bayfield Rd S
- 133 Commander Shea Blvd Unit 315
- 133 Commander Shea Blvd Unit 609
- 133 Commander Shea Blvd Unit 620
- 133 Commander Shea Blvd Unit 204
- 212 Quincy Shore Dr
- 297 Billings St
- 25 Hummock Rd
- 166 Quincy Shore Dr Unit 108