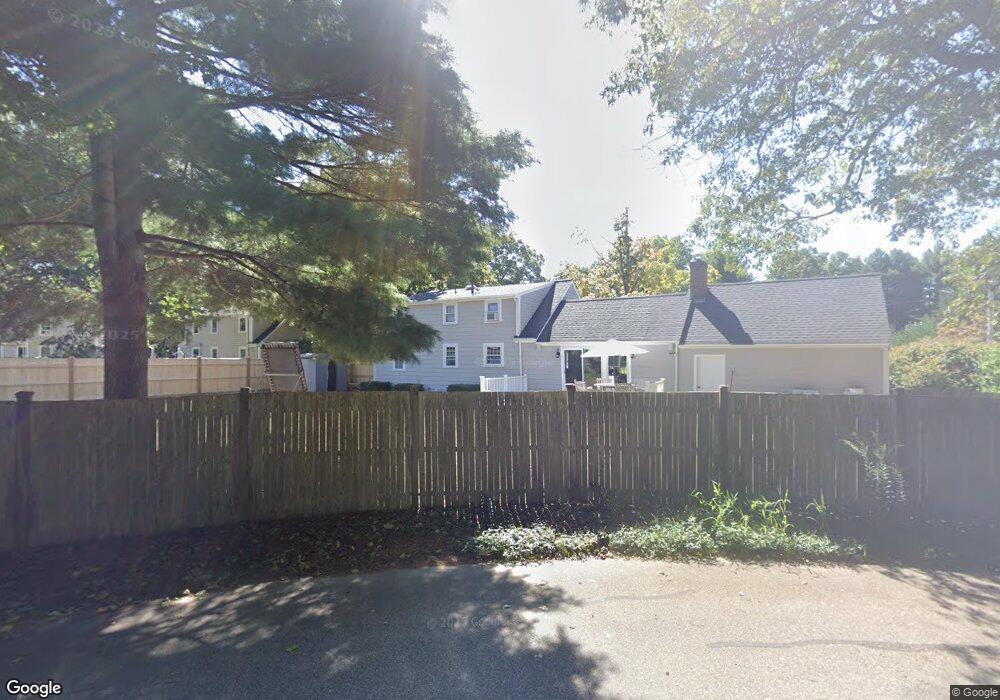
5 Codman Rd Hingham, MA 02043
South Hingham NeighborhoodEstimated Value: $1,040,103 - $1,318,000
4
Beds
2
Baths
1,865
Sq Ft
$634/Sq Ft
Est. Value
About This Home
This home is located at 5 Codman Rd, Hingham, MA 02043 and is currently estimated at $1,181,776, approximately $633 per square foot. 5 Codman Rd is a home located in Plymouth County with nearby schools including South Elementary School, Hingham Middle School, and Hingham High School.
Ownership History
Date
Name
Owned For
Owner Type
Purchase Details
Closed on
Mar 6, 2020
Sold by
Eisenhaure Barbara H
Bought by
Edward T Eisenhaure T
Current Estimated Value
Purchase Details
Closed on
Jul 14, 2014
Sold by
Eisenhaure Edward T and Eisenhaure Barbara H
Bought by
Eisenhaure Barbara H
Create a Home Valuation Report for This Property
The Home Valuation Report is an in-depth analysis detailing your home's value as well as a comparison with similar homes in the area
Home Values in the Area
Average Home Value in this Area
Purchase History
| Date | Buyer | Sale Price | Title Company |
|---|---|---|---|
| Edward T Eisenhaure T | -- | None Available | |
| Eisenhaure Barbara H | -- | -- |
Source: Public Records
Tax History Compared to Growth
Tax History
| Year | Tax Paid | Tax Assessment Tax Assessment Total Assessment is a certain percentage of the fair market value that is determined by local assessors to be the total taxable value of land and additions on the property. | Land | Improvement |
|---|---|---|---|---|
| 2025 | $9,215 | $862,000 | $462,500 | $399,500 |
| 2024 | $8,875 | $818,000 | $462,500 | $355,500 |
| 2023 | $7,701 | $770,100 | $462,500 | $307,600 |
| 2022 | $7,386 | $638,900 | $385,500 | $253,400 |
| 2021 | $7,311 | $619,600 | $385,500 | $234,100 |
| 2020 | $7,144 | $619,600 | $385,500 | $234,100 |
| 2019 | $7,077 | $599,200 | $385,500 | $213,700 |
| 2018 | $7,004 | $595,100 | $385,500 | $209,600 |
| 2017 | $6,985 | $570,200 | $373,700 | $196,500 |
| 2016 | $6,899 | $552,400 | $355,900 | $196,500 |
| 2015 | $6,710 | $535,500 | $339,000 | $196,500 |
Source: Public Records
Map
Nearby Homes
- 72 Scotland St
- 4 Richard Rd
- 1 Kerri Ln
- 4 Kerri Ln
- 32-70 Lazell St
- 70 Lazell St
- 183 Gardner St
- 32 Lazell St
- 21 S Bradford Rd
- 2 Black Rock Dr Unit 21
- 2 Black Rock Dr
- 100 Whiting St
- 18 Whiting Ln
- 251 Prospect St
- 249 High St
- 10 Colby Rd
- 22 Linscott Rd
- 86 Black Rock Dr
- 214 Washington St Unit 24
- 214 Washington St Unit 28