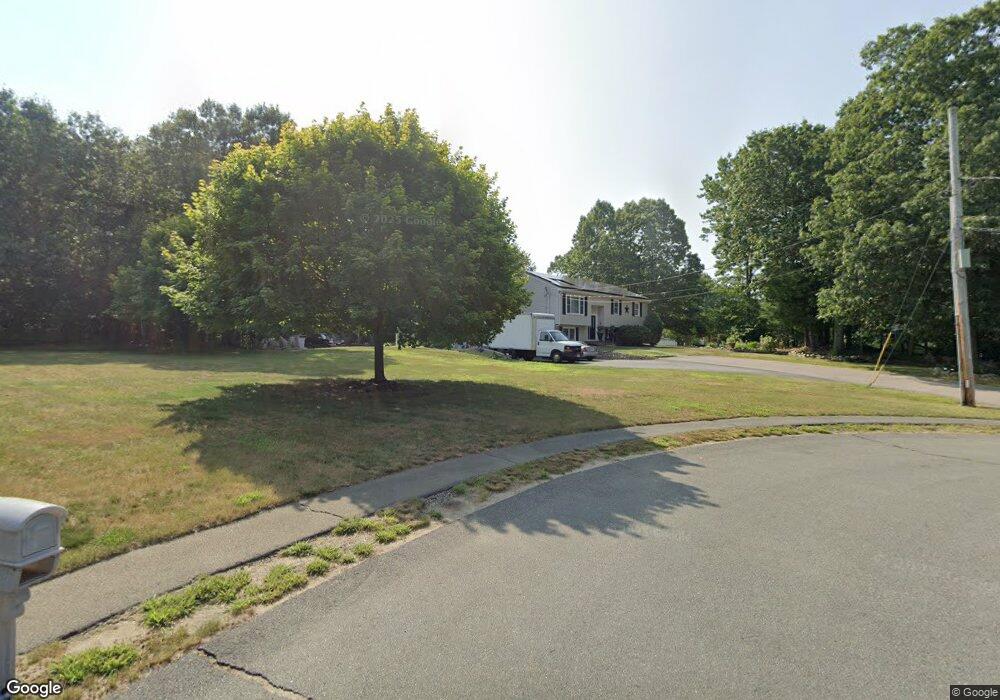
5 Coholan Dr Whitman, MA 02382
Estimated Value: $641,000 - $890,000
3
Beds
2
Baths
1,218
Sq Ft
$614/Sq Ft
Est. Value
About This Home
This home is located at 5 Coholan Dr, Whitman, MA 02382 and is currently estimated at $748,254, approximately $614 per square foot. 5 Coholan Dr is a home located in Plymouth County with nearby schools including Trinity Catholic Academy, Brockton Area Seventh-Day Adventist Academy, and Cardinal Spellman High School.
Ownership History
Date
Name
Owned For
Owner Type
Purchase Details
Closed on
Sep 20, 2006
Sold by
Centeio Tony and Centeio Maria V
Bought by
Centeio Maria
Current Estimated Value
Home Financials for this Owner
Home Financials are based on the most recent Mortgage that was taken out on this home.
Original Mortgage
$45,000
Interest Rate
6.59%
Mortgage Type
Purchase Money Mortgage
Purchase Details
Closed on
Dec 9, 1994
Sold by
Jcn Dev Corp
Bought by
Lopes Maria
Create a Home Valuation Report for This Property
The Home Valuation Report is an in-depth analysis detailing your home's value as well as a comparison with similar homes in the area
Home Values in the Area
Average Home Value in this Area
Purchase History
| Date | Buyer | Sale Price | Title Company |
|---|---|---|---|
| Centeio Maria | -- | -- | |
| Lopes Maria | $130,000 | -- |
Source: Public Records
Mortgage History
| Date | Status | Borrower | Loan Amount |
|---|---|---|---|
| Open | Lopes Maria | $251,000 | |
| Closed | Lopes Maria | $45,000 | |
| Previous Owner | Lopes Maria | $265,000 |
Source: Public Records
Tax History Compared to Growth
Tax History
| Year | Tax Paid | Tax Assessment Tax Assessment Total Assessment is a certain percentage of the fair market value that is determined by local assessors to be the total taxable value of land and additions on the property. | Land | Improvement |
|---|---|---|---|---|
| 2025 | $8,726 | $665,100 | $259,000 | $406,100 |
| 2024 | $7,745 | $607,900 | $254,300 | $353,600 |
| 2023 | $7,103 | $523,400 | $221,700 | $301,700 |
| 2022 | $6,993 | $480,300 | $201,400 | $278,900 |
| 2021 | $7,194 | $464,100 | $177,800 | $286,300 |
| 2020 | $6,399 | $403,700 | $168,800 | $234,900 |
| 2019 | $6,137 | $399,000 | $168,800 | $230,200 |
| 2018 | $5,844 | $365,000 | $155,300 | $209,700 |
| 2017 | $5,504 | $365,000 | $155,300 | $209,700 |
| 2016 | $5,168 | $331,500 | $149,700 | $181,800 |
| 2015 | $5,034 | $322,500 | $149,700 | $172,800 |
Source: Public Records
Map
Nearby Homes