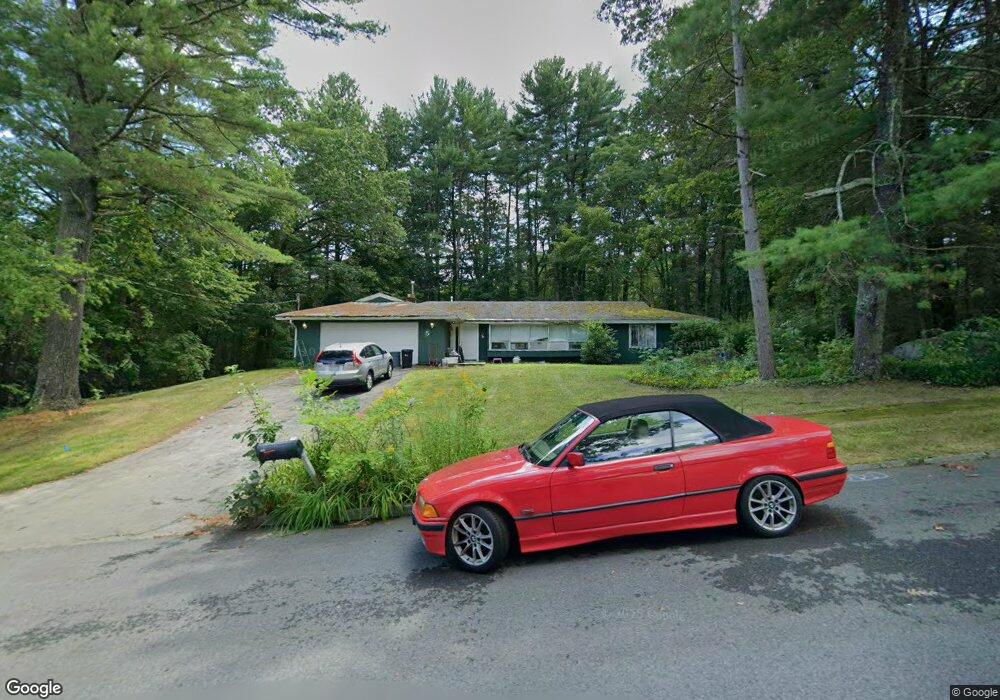
5 Comanche Cir Chelmsford, MA 01824
Old Stage Estates NeighborhoodEstimated Value: $624,000 - $759,000
3
Beds
3
Baths
1,450
Sq Ft
$477/Sq Ft
Est. Value
About This Home
This home is located at 5 Comanche Cir, Chelmsford, MA 01824 and is currently estimated at $691,689, approximately $477 per square foot. 5 Comanche Cir is a home located in Middlesex County with nearby schools including South Row Elementary School, McCarthy Middle School, and Chelmsford High School.
Ownership History
Date
Name
Owned For
Owner Type
Purchase Details
Closed on
Dec 29, 1999
Sold by
Turner Bryn K and Snell Cynthia A
Bought by
Brady-Bean Joyce
Current Estimated Value
Home Financials for this Owner
Home Financials are based on the most recent Mortgage that was taken out on this home.
Original Mortgage
$180,000
Outstanding Balance
$56,632
Interest Rate
7.71%
Mortgage Type
Purchase Money Mortgage
Estimated Equity
$635,058
Purchase Details
Closed on
Jan 26, 1996
Sold by
Layton Bruce P
Bought by
Turner Bryn and Snell Cynthia
Home Financials for this Owner
Home Financials are based on the most recent Mortgage that was taken out on this home.
Original Mortgage
$131,400
Interest Rate
7.13%
Mortgage Type
Purchase Money Mortgage
Create a Home Valuation Report for This Property
The Home Valuation Report is an in-depth analysis detailing your home's value as well as a comparison with similar homes in the area
Home Values in the Area
Average Home Value in this Area
Purchase History
| Date | Buyer | Sale Price | Title Company |
|---|---|---|---|
| Brady-Bean Joyce | $225,000 | -- | |
| Brady-Bean Joyce | $225,000 | -- | |
| Turner Bryn | $146,000 | -- | |
| Turner Bryn | $146,000 | -- |
Source: Public Records
Mortgage History
| Date | Status | Borrower | Loan Amount |
|---|---|---|---|
| Open | Turner Bryn | $180,000 | |
| Closed | Turner Bryn | $180,000 | |
| Previous Owner | Turner Bryn | $131,400 |
Source: Public Records
Tax History
| Year | Tax Paid | Tax Assessment Tax Assessment Total Assessment is a certain percentage of the fair market value that is determined by local assessors to be the total taxable value of land and additions on the property. | Land | Improvement |
|---|---|---|---|---|
| 2025 | $8,049 | $579,100 | $348,200 | $230,900 |
| 2024 | $7,819 | $574,100 | $348,200 | $225,900 |
| 2023 | $7,826 | $544,600 | $373,900 | $170,700 |
| 2022 | $7,513 | $476,400 | $314,700 | $161,700 |
| 2021 | $6,826 | $433,700 | $288,700 | $145,000 |
| 2020 | $6,830 | $415,200 | $255,700 | $159,500 |
| 2019 | $6,605 | $404,000 | $253,200 | $150,800 |
| 2018 | $6,735 | $375,000 | $227,900 | $147,100 |
| 2017 | $6,283 | $350,600 | $213,400 | $137,200 |
| 2016 | $5,867 | $325,400 | $202,500 | $122,900 |
| 2015 | $5,711 | $305,400 | $184,000 | $121,400 |
| 2014 | $5,500 | $289,800 | $173,500 | $116,300 |
Source: Public Records
Map
Nearby Homes
- 24 Algonquin Rd
- 55 Parker Rd
- 1 Rosemary Ln
- 3 Blaisdell Rd
- 101 Hunt Rd
- 80 Daniels Ln
- 243 Mason Ave
- 235 New Yorker Ave
- 192 Mason Ave
- 189 Littleton Rd Unit 59
- 9 Acton Rd Unit 2
- 9 Acton Rd Unit 6
- 9 Acton Rd Unit 10
- 9 Acton Rd Unit 8
- 360 Littleton Rd Unit A4
- 360 Littleton Rd Unit D8
- 143 Pine Hill Rd
- 34 Clover Hill Dr
- 215 Rangeway Rd Unit 11
- 14 Kay's Walk
Your Personal Tour Guide
Ask me questions while you tour the home.