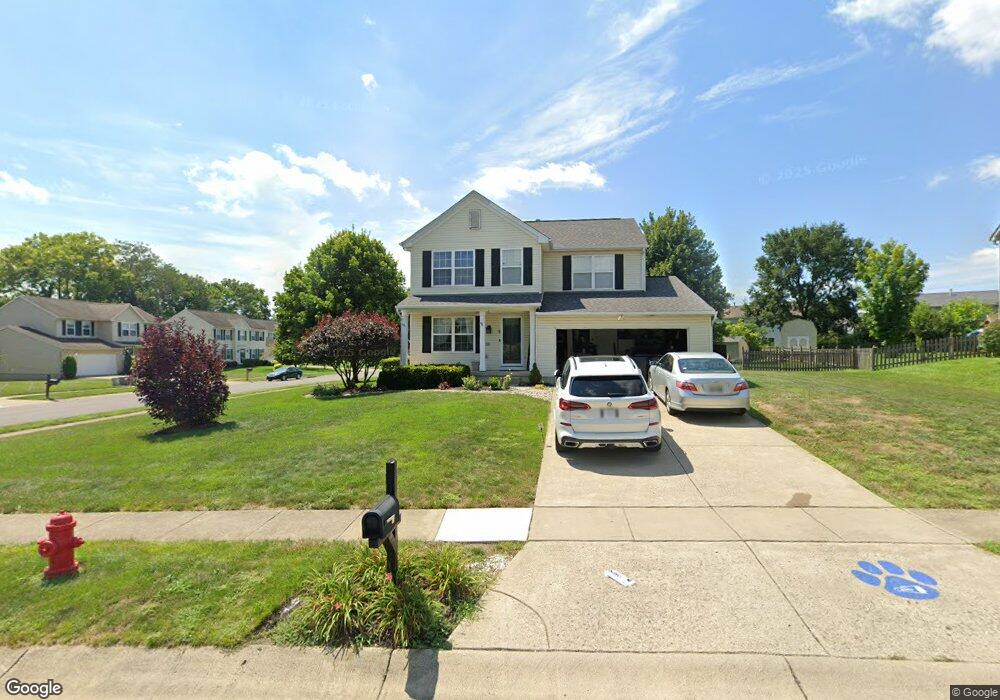
5 Concord Cir Springboro, OH 45066
Estimated Value: $376,000 - $403,000
4
Beds
3
Baths
2,052
Sq Ft
$192/Sq Ft
Est. Value
About This Home
This home is located at 5 Concord Cir, Springboro, OH 45066 and is currently estimated at $393,487, approximately $191 per square foot. 5 Concord Cir is a home located in Warren County with nearby schools including Clearcreek Elementary School, Springboro Intermediate School, and Dennis Elementary School.
Ownership History
Date
Name
Owned For
Owner Type
Purchase Details
Closed on
Feb 14, 2014
Sold by
Bell Jennifer A
Bought by
Bell William E
Current Estimated Value
Home Financials for this Owner
Home Financials are based on the most recent Mortgage that was taken out on this home.
Original Mortgage
$120,000
Outstanding Balance
$91,377
Interest Rate
4.54%
Mortgage Type
Future Advance Clause Open End Mortgage
Estimated Equity
$302,110
Purchase Details
Closed on
Apr 24, 2007
Sold by
Maclellan Patrick T and Maclellan Angela M
Bought by
Bell Jennifer A
Home Financials for this Owner
Home Financials are based on the most recent Mortgage that was taken out on this home.
Original Mortgage
$157,600
Interest Rate
6.18%
Mortgage Type
Purchase Money Mortgage
Purchase Details
Closed on
Oct 2, 2001
Sold by
Williamsburg Prop Inc
Bought by
Maclellan Patrick and Maclellan Angela
Home Financials for this Owner
Home Financials are based on the most recent Mortgage that was taken out on this home.
Original Mortgage
$172,600
Interest Rate
6.97%
Mortgage Type
New Conventional
Purchase Details
Closed on
Jun 27, 2001
Sold by
Brookfield Dev Corp
Bought by
Williamsburg Prop Inc
Create a Home Valuation Report for This Property
The Home Valuation Report is an in-depth analysis detailing your home's value as well as a comparison with similar homes in the area
Home Values in the Area
Average Home Value in this Area
Purchase History
| Date | Buyer | Sale Price | Title Company |
|---|---|---|---|
| Bell William E | $151,500 | Triad Title Agency Inc | |
| Bell Jennifer A | $197,000 | Attorney | |
| Maclellan Patrick | $181,703 | -- | |
| Williamsburg Prop Inc | $151,400 | -- |
Source: Public Records
Mortgage History
| Date | Status | Borrower | Loan Amount |
|---|---|---|---|
| Open | Bell William E | $120,000 | |
| Previous Owner | Bell Jennifer A | $157,600 | |
| Previous Owner | Maclellan Patrick | $172,600 |
Source: Public Records
Tax History Compared to Growth
Tax History
| Year | Tax Paid | Tax Assessment Tax Assessment Total Assessment is a certain percentage of the fair market value that is determined by local assessors to be the total taxable value of land and additions on the property. | Land | Improvement |
|---|---|---|---|---|
| 2024 | $4,689 | $116,790 | $31,500 | $85,290 |
| 2023 | $3,770 | $85,613 | $17,220 | $68,393 |
| 2022 | $3,712 | $85,614 | $17,220 | $68,394 |
| 2021 | $3,460 | $85,614 | $17,220 | $68,394 |
| 2020 | $3,220 | $69,605 | $14,000 | $55,605 |
| 2019 | $2,980 | $69,605 | $14,000 | $55,605 |
| 2018 | $2,979 | $69,605 | $14,000 | $55,605 |
| 2017 | $2,887 | $60,774 | $12,422 | $48,353 |
| 2016 | $3,002 | $60,774 | $12,422 | $48,353 |
| 2015 | $2,906 | $60,774 | $12,422 | $48,353 |
| 2014 | $2,789 | $55,250 | $11,290 | $43,960 |
| 2013 | $2,787 | $68,510 | $14,000 | $54,510 |
Source: Public Records
Map
Nearby Homes
- 80 N Lakeshore Dr
- 175 S Lakeshore Dr
- 6950 Red Lion 5 Points Rd
- 65 W Waterbury Dr
- 130 Magnolia Ln
- 165 Magnolia Ln
- Rockford Plan at Clearview Crossing
- Sanibel Plan at Clearview Crossing
- Birmingham Plan at Clearview Crossing
- Avalon Plan at Clearview Crossing
- Somerset Plan at Clearview Crossing
- The Longwood Plan at Clearview Crossing
- Dallas Plan at Clearview Crossing
- Carlisle Plan at Clearview Crossing
- 135 Magnolia Ln
- 1045 Ohio 73
- 85 Chestnut St
- 45 Chestnut St
- 55 Chestnut St
- 25 Chestnut St
- 15 Concord Cir
- 160 Cambridge Dr
- 195 Cambridge Dr
- 25 Concord Cir
- 140 Cambridge Dr
- 185 Cambridge Dr
- 205 Cambridge Dr
- 120 Cambridge Dr
- 175 Cambridge Dr
- 215 Cambridge Dr
- 80 Cambridge Dr
- 35 Concord Cir
- 20 Concord Cir
- 165 Cambridge Dr
- 225 Cambridge Dr
- 70 Cambridge Dr
- 30 Concord Cir
- 45 Concord Cir
- 95 N Lakeshore Dr
- 60 Cambridge Dr