5 Cooper Rd Mendham, NJ 07945
Estimated Value: $1,348,000 - $1,621,000
Studio
--
Bath
3,181
Sq Ft
$460/Sq Ft
Est. Value
About This Home
This home is located at 5 Cooper Rd, Mendham, NJ 07945 and is currently estimated at $1,464,794, approximately $460 per square foot. 5 Cooper Rd is a home located in Morris County with nearby schools including Mendham Township Elementary School, Mendham Township Middle School, and West Morris Mendham High School.
Ownership History
Date
Name
Owned For
Owner Type
Purchase Details
Closed on
Oct 21, 2005
Sold by
Davis Sanders W
Bought by
Davis Kathryn Fischer and Davis Sanders W
Current Estimated Value
Purchase Details
Closed on
Jul 15, 1996
Sold by
Grimm Mark D and Grimm Barbara Y
Bought by
Davis Sanders W and Davis Kathryn F
Home Financials for this Owner
Home Financials are based on the most recent Mortgage that was taken out on this home.
Original Mortgage
$372,000
Interest Rate
7.78%
Purchase Details
Closed on
Aug 21, 1994
Sold by
Pitney Farms Assoc
Bought by
Grimm Mark and Grimm Barbara
Home Financials for this Owner
Home Financials are based on the most recent Mortgage that was taken out on this home.
Original Mortgage
$245,000
Interest Rate
8.44%
Create a Home Valuation Report for This Property
The Home Valuation Report is an in-depth analysis detailing your home's value as well as a comparison with similar homes in the area
Home Values in the Area
Average Home Value in this Area
Purchase History
We collect this data history from publicly available records. To have your information removed, we recommend requesting removal directly through your county’s website.
| Date | Buyer | Sale Price | Title Company |
|---|---|---|---|
| Davis Kathryn Fischer | -- | -- | |
| Davis Sanders W | $465,000 | -- | |
| Grimm Mark | $436,100 | -- |
Source: Public Records
Mortgage History
We collect this data history from publicly available records. To have your information removed, we recommend requesting removal directly through your county’s website.
| Date | Status | Borrower | Loan Amount |
|---|---|---|---|
| Previous Owner | Davis Sanders W | $372,000 | |
| Previous Owner | Grimm Mark | $245,000 |
Source: Public Records
Tax History
| Year | Tax Paid | Tax Assessment Tax Assessment Total Assessment is a certain percentage of the fair market value that is determined by local assessors to be the total taxable value of land and additions on the property. | Land | Improvement |
|---|---|---|---|---|
| 2025 | $19,282 | $1,117,400 | $484,100 | $633,300 |
| 2024 | $18,590 | $992,900 | $388,100 | $604,800 |
| 2023 | $18,590 | $889,900 | $323,300 | $566,600 |
| 2022 | $17,914 | $865,800 | $314,000 | $551,800 |
| 2021 | $17,914 | $809,500 | $343,200 | $466,300 |
| 2020 | $17,801 | $809,500 | $343,200 | $466,300 |
| 2019 | $17,469 | $809,500 | $343,200 | $466,300 |
| 2018 | $17,137 | $809,500 | $343,200 | $466,300 |
| 2017 | $16,740 | $809,500 | $343,200 | $466,300 |
| 2016 | $16,716 | $809,500 | $343,200 | $466,300 |
| 2015 | $16,409 | $809,500 | $343,200 | $466,300 |
| 2014 | $16,036 | $809,500 | $343,200 | $466,300 |
Source: Public Records
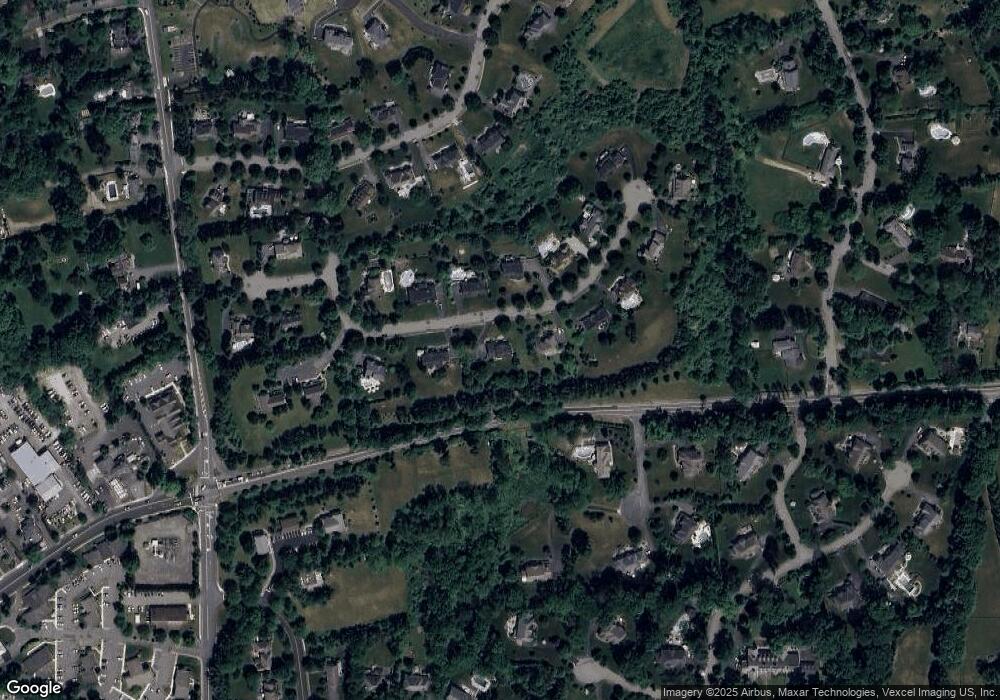
Map
Nearby Homes
Your Personal Tour Guide
Ask me questions while you tour the home.