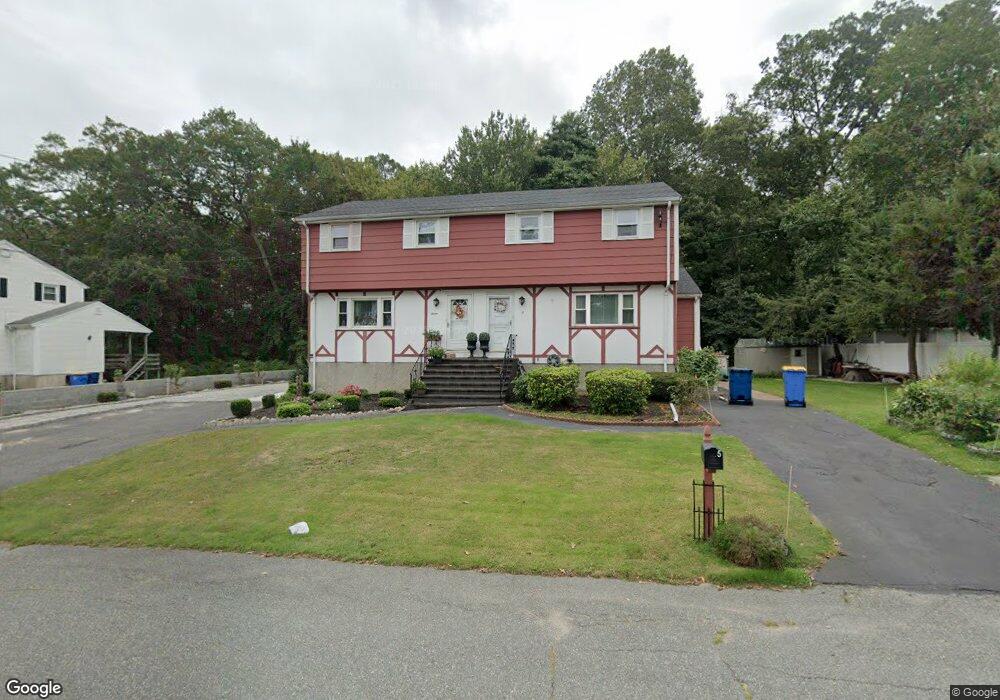
5 Corcoran St Randolph, MA 02368
Downtown Randolph NeighborhoodEstimated Value: $384,000 - $546,000
3
Beds
2
Baths
1,267
Sq Ft
$349/Sq Ft
Est. Value
About This Home
This home is located at 5 Corcoran St, Randolph, MA 02368 and is currently estimated at $441,927, approximately $348 per square foot. 5 Corcoran St is a home located in Norfolk County with nearby schools including Randolph High School, Boston Higashi School, and Lighthouse Baptist Christian Academy.
Ownership History
Date
Name
Owned For
Owner Type
Purchase Details
Closed on
Dec 28, 2001
Sold by
Chin Yang P
Bought by
Chan Peter Y and Chan Amy F
Current Estimated Value
Home Financials for this Owner
Home Financials are based on the most recent Mortgage that was taken out on this home.
Original Mortgage
$78,600
Outstanding Balance
$31,135
Interest Rate
6.61%
Mortgage Type
Purchase Money Mortgage
Estimated Equity
$410,792
Purchase Details
Closed on
Oct 11, 1996
Sold by
Gragg Douglas T and Gragg Judith A
Bought by
Chin Yang P
Purchase Details
Closed on
Aug 24, 1989
Sold by
Slapak Joseph
Bought by
Gragg Douglas T
Home Financials for this Owner
Home Financials are based on the most recent Mortgage that was taken out on this home.
Original Mortgage
$112,800
Interest Rate
9.67%
Mortgage Type
Purchase Money Mortgage
Create a Home Valuation Report for This Property
The Home Valuation Report is an in-depth analysis detailing your home's value as well as a comparison with similar homes in the area
Home Values in the Area
Average Home Value in this Area
Purchase History
| Date | Buyer | Sale Price | Title Company |
|---|---|---|---|
| Chan Peter Y | $185,000 | -- | |
| Chin Yang P | $100,450 | -- | |
| Gragg Douglas T | $141,000 | -- |
Source: Public Records
Mortgage History
| Date | Status | Borrower | Loan Amount |
|---|---|---|---|
| Open | Chan Peter Y | $78,600 | |
| Previous Owner | Gragg Douglas T | $112,800 |
Source: Public Records
Tax History
| Year | Tax Paid | Tax Assessment Tax Assessment Total Assessment is a certain percentage of the fair market value that is determined by local assessors to be the total taxable value of land and additions on the property. | Land | Improvement |
|---|---|---|---|---|
| 2025 | $4,291 | $369,600 | $0 | $369,600 |
| 2024 | $4,326 | $377,800 | $0 | $377,800 |
| 2023 | $3,957 | $327,600 | $0 | $327,600 |
| 2022 | $3,838 | $282,200 | $0 | $282,200 |
| 2021 | $3,636 | $246,000 | $0 | $246,000 |
| 2020 | $3,720 | $249,500 | $0 | $249,500 |
| 2019 | $3,627 | $242,100 | $0 | $242,100 |
| 2018 | $3,435 | $216,300 | $0 | $216,300 |
| 2017 | $3,341 | $206,500 | $0 | $206,500 |
| 2016 | $3,255 | $187,200 | $0 | $187,200 |
| 2015 | $3,187 | $176,100 | $0 | $176,100 |
Source: Public Records
Map
Nearby Homes
- 43 West St Unit A2
- 153 West St
- 16 Grove Square Unit 16
- 54 Jasper Ln
- 33 Hemlock Terrace
- 159 Bittersweet Ln Unit 107
- 59 Highland Glen Dr Unit 328
- 54 Highland Glen Dr
- 17 Mazzeo Dr
- 6 Eagle Rd
- 591 N Main St
- 20 Simmonds Blvd Unit 20
- 18 Simmonds Blvd Unit 18
- 8 Simmonds Blvd Unit 8
- 22 Simmonds Blvd Unit 22
- 10 Simmonds Blvd Unit 10
- 24 Simmonds Blvd Unit 24
- 6 Simmonds Blvd Unit 6
- 7 Van Beal Rd
- 43 Emily Jeffers Rd
Your Personal Tour Guide
Ask me questions while you tour the home.