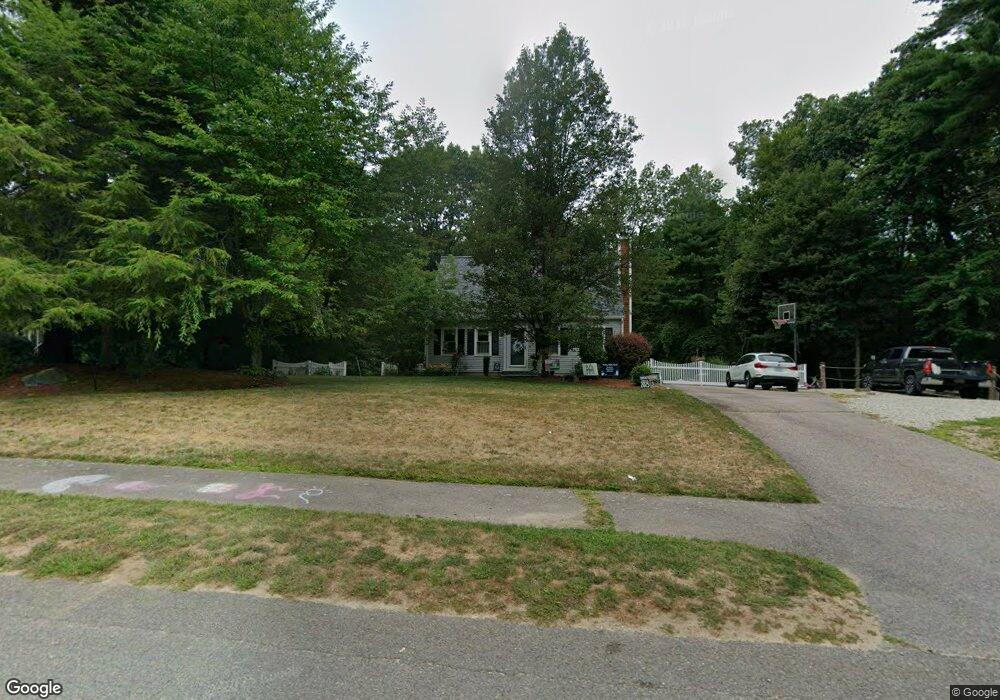
5 Crabapple Dr Berkley, MA 02779
Estimated Value: $531,000 - $623,000
3
Beds
2
Baths
1,686
Sq Ft
$350/Sq Ft
Est. Value
About This Home
This home is located at 5 Crabapple Dr, Berkley, MA 02779 and is currently estimated at $589,595, approximately $349 per square foot. 5 Crabapple Dr is a home located in Bristol County with nearby schools including Berkley Community School.
Ownership History
Date
Name
Owned For
Owner Type
Purchase Details
Closed on
Sep 24, 2025
Sold by
Castonguay Gil and Castonguay Andrea
Bought by
Castonguay Ret and Castonguay
Current Estimated Value
Purchase Details
Closed on
Sep 30, 2004
Sold by
Lecomte Heidi and Lecomte Shawn
Bought by
Castonguay Andrea and Castonguay Gil
Home Financials for this Owner
Home Financials are based on the most recent Mortgage that was taken out on this home.
Original Mortgage
$250,000
Interest Rate
5.81%
Mortgage Type
Purchase Money Mortgage
Purchase Details
Closed on
Dec 3, 2001
Sold by
Mauricio Manuel F
Bought by
Lecomte Shawn and Lecomte Heidi
Purchase Details
Closed on
Jun 23, 1994
Sold by
Mdj Constr & Inv Corp
Bought by
Mauricio Manuel F
Create a Home Valuation Report for This Property
The Home Valuation Report is an in-depth analysis detailing your home's value as well as a comparison with similar homes in the area
Home Values in the Area
Average Home Value in this Area
Purchase History
| Date | Buyer | Sale Price | Title Company |
|---|---|---|---|
| Castonguay Ret | -- | -- | |
| Castonguay Andrea | $350,000 | -- | |
| Castonguay Andrea | $350,000 | -- | |
| Lecomte Shawn | $240,000 | -- | |
| Mauricio Manuel F | $146,075 | -- |
Source: Public Records
Mortgage History
| Date | Status | Borrower | Loan Amount |
|---|---|---|---|
| Previous Owner | Mauricio Manuel F | $224,000 | |
| Previous Owner | Mauricio Manuel F | $230,000 | |
| Previous Owner | Castonguay Andrea | $250,000 |
Source: Public Records
Tax History Compared to Growth
Tax History
| Year | Tax Paid | Tax Assessment Tax Assessment Total Assessment is a certain percentage of the fair market value that is determined by local assessors to be the total taxable value of land and additions on the property. | Land | Improvement |
|---|---|---|---|---|
| 2025 | $60 | $499,300 | $149,400 | $349,900 |
| 2024 | $5,742 | $461,200 | $128,700 | $332,500 |
| 2023 | $5,496 | $415,700 | $128,700 | $287,000 |
| 2022 | $5,350 | $389,100 | $111,900 | $277,200 |
| 2021 | $5,205 | $364,500 | $106,600 | $257,900 |
| 2020 | $5,046 | $347,300 | $94,100 | $253,200 |
| 2019 | $4,860 | $332,000 | $94,100 | $237,900 |
| 2018 | $4,449 | $317,300 | $90,500 | $226,800 |
| 2017 | $4,331 | $302,900 | $101,400 | $201,500 |
| 2016 | $4,152 | $279,800 | $101,400 | $178,400 |
| 2015 | $3,696 | $265,700 | $101,400 | $164,300 |
| 2014 | $3,514 | $274,300 | $110,000 | $164,300 |
Source: Public Records
Map
Nearby Homes
- 70 Plain St E
- 59 Seymour St
- 81 Tania Dr
- 220 Erin Rd
- 203 Bluejay Ln
- 2 Bc Ln
- 2 Lima Ln
- 50 Azalea Dr Unit 50
- 68 Metacomet Ave
- 3 Karena Dr Unit 8
- 28 B Staples St Unit B
- 52 Anthony St
- 218R Hart St Unit B
- 29 Williams Ave
- 170 Hart St Unit B
- 11 Talbot Ave
- 147 Colonial Dr
- 8 Herbert St
- 66 S Main St
- 1 Fayal Ave