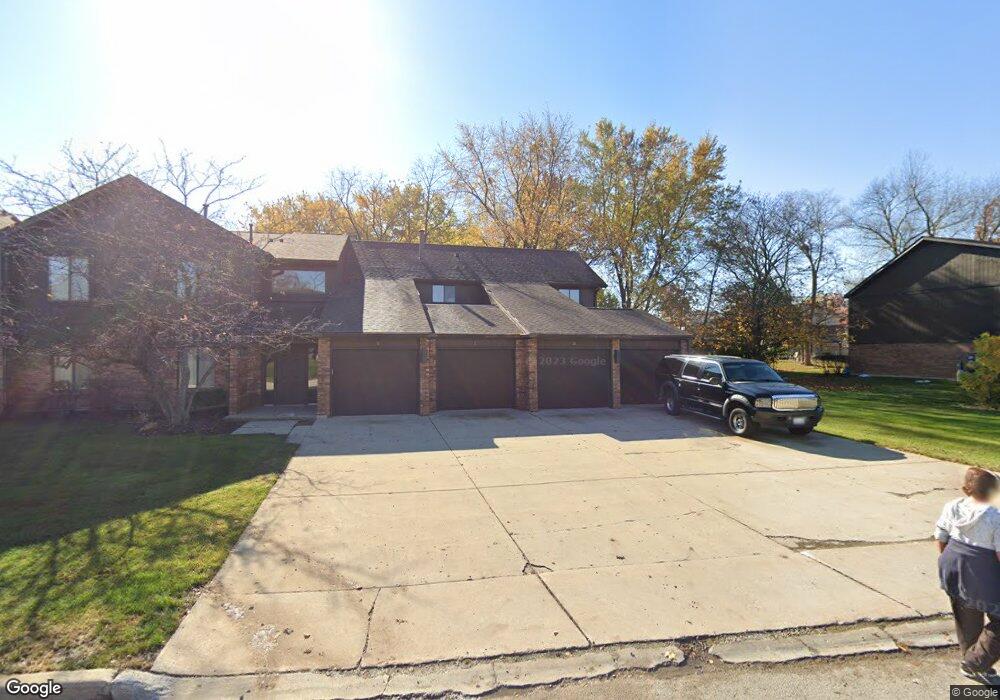
5 Creekside Cir Unit C Elgin, IL 60123
Century Oaks West NeighborhoodEstimated Value: $199,069 - $267,000
2
Beds
--
Bath
986
Sq Ft
$226/Sq Ft
Est. Value
About This Home
This home is located at 5 Creekside Cir Unit C, Elgin, IL 60123 and is currently estimated at $222,767, approximately $225 per square foot. 5 Creekside Cir Unit C is a home located in Kane County with nearby schools including Century Oaks Elementary School, Kimball Middle School, and Larkin High School.
Ownership History
Date
Name
Owned For
Owner Type
Purchase Details
Closed on
Aug 12, 2003
Sold by
Mitchell Judson G
Bought by
Demetrakakes Pan
Current Estimated Value
Home Financials for this Owner
Home Financials are based on the most recent Mortgage that was taken out on this home.
Original Mortgage
$110,000
Interest Rate
6.44%
Mortgage Type
Purchase Money Mortgage
Purchase Details
Closed on
Jan 29, 2003
Sold by
Stonecipher Chad
Bought by
Mitchell Judson G
Home Financials for this Owner
Home Financials are based on the most recent Mortgage that was taken out on this home.
Original Mortgage
$109,500
Interest Rate
7.2%
Mortgage Type
Purchase Money Mortgage
Purchase Details
Closed on
Dec 22, 2000
Sold by
Fagan Gerald J and Fagan Linda
Bought by
Stonecipher Chad
Home Financials for this Owner
Home Financials are based on the most recent Mortgage that was taken out on this home.
Original Mortgage
$81,700
Interest Rate
7.8%
Create a Home Valuation Report for This Property
The Home Valuation Report is an in-depth analysis detailing your home's value as well as a comparison with similar homes in the area
Home Values in the Area
Average Home Value in this Area
Purchase History
| Date | Buyer | Sale Price | Title Company |
|---|---|---|---|
| Demetrakakes Pan | $137,500 | -- | |
| Mitchell Judson G | $123,000 | Ticor Title Insurance Compan | |
| Stonecipher Chad | $86,000 | -- |
Source: Public Records
Mortgage History
| Date | Status | Borrower | Loan Amount |
|---|---|---|---|
| Closed | Demetrakakes Pan | $110,000 | |
| Previous Owner | Mitchell Judson G | $109,500 | |
| Previous Owner | Stonecipher Chad | $81,700 |
Source: Public Records
Tax History
| Year | Tax Paid | Tax Assessment Tax Assessment Total Assessment is a certain percentage of the fair market value that is determined by local assessors to be the total taxable value of land and additions on the property. | Land | Improvement |
|---|---|---|---|---|
| 2024 | $2,071 | $55,126 | $8,371 | $46,755 |
| 2023 | $2,212 | $49,601 | $7,532 | $42,069 |
| 2022 | $2,713 | $43,901 | $7,532 | $36,369 |
| 2021 | $2,782 | $41,452 | $7,112 | $34,340 |
| 2020 | $3,307 | $40,520 | $6,952 | $33,568 |
| 2019 | $3,194 | $38,466 | $6,600 | $31,866 |
| 2018 | $2,785 | $32,748 | $6,469 | $26,279 |
| 2017 | $2,303 | $27,264 | $6,051 | $21,213 |
| 2016 | $2,320 | $26,398 | $5,859 | $20,539 |
| 2015 | -- | $21,292 | $5,490 | $15,802 |
| 2014 | -- | $20,704 | $5,338 | $15,366 |
| 2013 | -- | $25,662 | $5,501 | $20,161 |
Source: Public Records
Map
Nearby Homes
- 43 Creekside Cir Unit A
- 1345 S Madlock Ct
- 1932 Banks Dr
- 14 Devonshire Cir Unit 1
- 1348 Sheffield Dr
- 1583 Sheffield Dr Unit 85
- 1212 Century Oaks Dr
- 1865 Kevin Ave Unit 5
- 2176 Jordan Ln
- 906 Carol Ave
- 1009 Meadow Ln
- 36W628 Oak Hill Dr
- 36W474 Hickory Hollow Dr
- 938 Hillcrest Rd
- 801 N Mclean Blvd Unit 320
- 801 N Mclean Blvd Unit 324
- 801 N Mclean Blvd Unit 118
- 801 N Mclean Blvd Unit 124
- 801 N Mclean Blvd Unit 222
- 1419 Harlan Ave
- 5 Creekside Cir Unit D
- 5 Creekside Cir Unit A
- 7 Creekside Cir Unit D
- 7 Creekside Cir Unit B
- 7 Creekside Cir Unit C
- 7 Creekside Cir Unit A
- 7 Creekside Cir Unit 7D
- 31 Lockman Cir
- 33 Lockman Cir
- 9 Creekside Cir Unit D
- 9 Creekside Cir Unit B
- 9 Creekside Cir Unit A
- 9 Creekside Cir Unit C
- 9 Creekside Cir
- 3 Creekside Cir Unit B
- 3 Creekside Cir Unit A
- 3 Creekside Cir Unit C
- 3 Creekside Cir Unit D
- 4 Creekside Cir Unit A
- 4 Creekside Cir Unit B
Your Personal Tour Guide
Ask me questions while you tour the home.