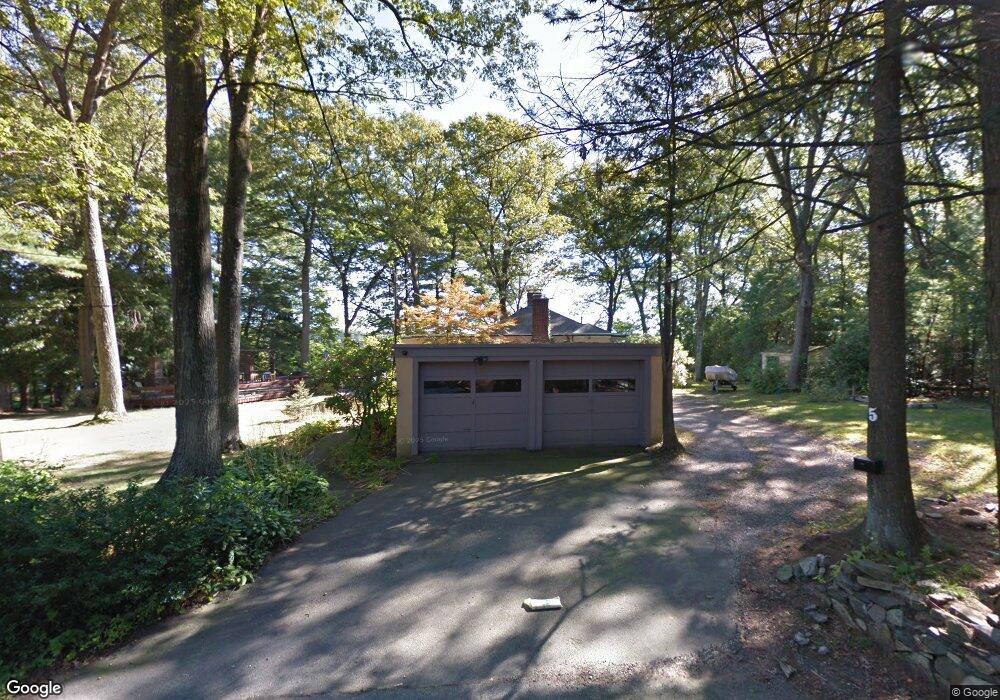
5 Crescent St Natick, MA 01760
Estimated Value: $1,125,300 - $1,387,000
3
Beds
3
Baths
1,931
Sq Ft
$667/Sq Ft
Est. Value
About This Home
This home is located at 5 Crescent St, Natick, MA 01760 and is currently estimated at $1,287,325, approximately $666 per square foot. 5 Crescent St is a home located in Middlesex County with nearby schools including Natick High School, J F Kennedy Middle School, and Johnson Elementary School.
Ownership History
Date
Name
Owned For
Owner Type
Purchase Details
Closed on
Jun 20, 2018
Sold by
Knowlton Scott and Knowlton Julie
Bought by
Knowlton Julie
Current Estimated Value
Purchase Details
Closed on
May 5, 2010
Sold by
Singh Falguni V
Bought by
Knowlton Scott and Knowlton Julie
Home Financials for this Owner
Home Financials are based on the most recent Mortgage that was taken out on this home.
Original Mortgage
$629,000
Interest Rate
5.03%
Mortgage Type
Purchase Money Mortgage
Purchase Details
Closed on
Aug 18, 1993
Sold by
Hall William C and Hall William C
Bought by
Gray Peter O and Gray Anita G
Home Financials for this Owner
Home Financials are based on the most recent Mortgage that was taken out on this home.
Original Mortgage
$242,000
Interest Rate
7.11%
Mortgage Type
Purchase Money Mortgage
Create a Home Valuation Report for This Property
The Home Valuation Report is an in-depth analysis detailing your home's value as well as a comparison with similar homes in the area
Home Values in the Area
Average Home Value in this Area
Purchase History
| Date | Buyer | Sale Price | Title Company |
|---|---|---|---|
| Knowlton Julie | -- | -- | |
| Knowlton Scott | $740,000 | -- | |
| Gray Peter O | $302,500 | -- |
Source: Public Records
Mortgage History
| Date | Status | Borrower | Loan Amount |
|---|---|---|---|
| Previous Owner | Knowlton Scott | $629,000 | |
| Previous Owner | Gray Peter O | $220,000 | |
| Previous Owner | Gray Peter O | $242,000 |
Source: Public Records
Tax History Compared to Growth
Tax History
| Year | Tax Paid | Tax Assessment Tax Assessment Total Assessment is a certain percentage of the fair market value that is determined by local assessors to be the total taxable value of land and additions on the property. | Land | Improvement |
|---|---|---|---|---|
| 2025 | $13,197 | $1,103,400 | $696,400 | $407,000 |
| 2024 | $12,247 | $998,900 | $616,100 | $382,800 |
| 2023 | $11,901 | $941,500 | $564,100 | $377,400 |
| 2022 | $11,456 | $858,800 | $507,400 | $351,400 |
| 2021 | $4,776 | $784,800 | $454,600 | $330,200 |
| 2020 | $10,702 | $786,300 | $454,600 | $331,700 |
| 2019 | $9,994 | $786,300 | $454,600 | $331,700 |
| 2018 | $10,200 | $781,600 | $454,600 | $327,000 |
| 2017 | $10,300 | $763,500 | $442,300 | $321,200 |
| 2016 | $9,864 | $726,900 | $408,700 | $318,200 |
| 2015 | $9,290 | $672,200 | $383,100 | $289,100 |
Source: Public Records
Map
Nearby Homes
- 2 Lodge Rd
- 21 Kelsey Rd
- 55 Fisher St
- 38 Ranger Rd
- 91 Speen St
- 18 2nd St
- 34 Fisher St
- 8 Hartford St
- 44 Silver Hill Ln Unit 15
- 32 Silver Hill Ln Unit 1
- 4 Sylvia Ave
- 293 Bacon St Unit A
- 293 Bacon St Unit B
- 1 Silver Hill Ln Unit 7
- 7 Jackson Ct Unit B
- 11 Silver Hill Ln Unit 11
- 9 Silver Hill Ln Unit 19
- 7 Village Way Unit 4
- 7 Overhill Rd
- 11 Post Oak Ln Unit 6