D
Seller's Agent in 2025
Doris Grandinetti
Concierge Real Estate, LLC
(617) 803-7702
2 in this area
40 Total Sales


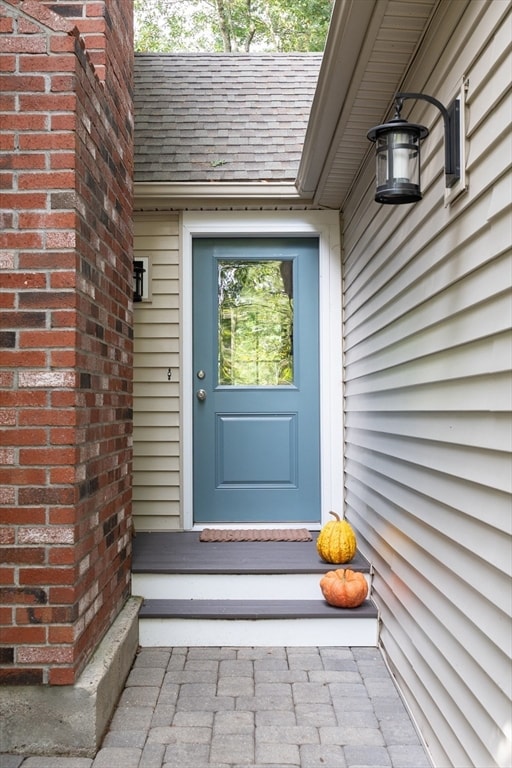
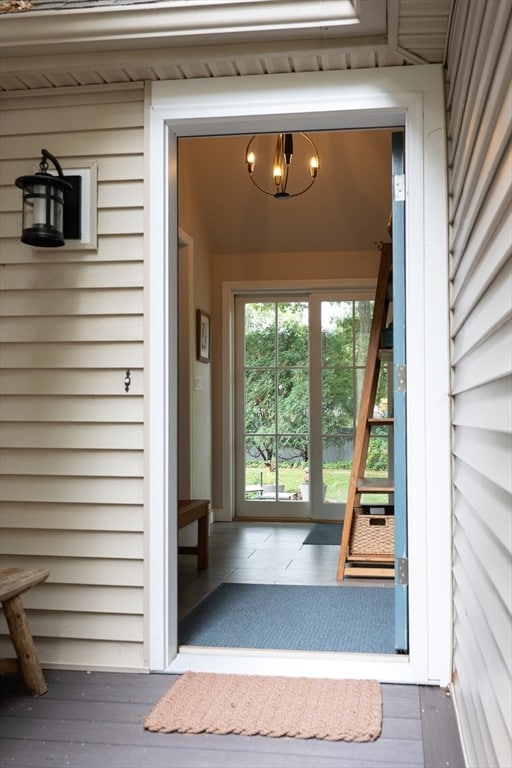


An exceptional younger Cape-style home located in a desirable Natick neighborhood with nearby schools and shopping. This impeccably maintained home features a thoughtfully remodeled open floor plan with premium finishes throughout. Enter through the cathedral ceiling mudroom with glass sliders to the patio and direct access to an oversized garage. The kitchen includes white shaker cabinets, granite counters, stainless steel appliances and counter seating. The living room features a modern floor-to-ceiling fireplace and large picture window. Triple glass sliders in the dining room lead to a beautifully landscaped backyard with mature trees, perennial gardens and a large patio. A bedroom and bathroom with a glass enclosed shower round out the first floor. Upstairs includes two generously sized bedrooms and a full bath. The newly remodeled heated basement with luxury vinyl plank floors is perfect for a home office, family/playroom or gym. A move-in ready gem!
| Date | Type | Sale Price | Title Company |
|---|---|---|---|
| Quit Claim Deed | $920,000 | -- | |
| Deed | $176,000 | -- | |
| Deed | $176,000 | -- | |
| Deed | $174,000 | -- | |
| Deed | $174,000 | -- |
| Date | Status | Loan Amount | Loan Type |
|---|---|---|---|
| Open | $736,000 | New Conventional | |
| Previous Owner | $50,000 | No Value Available |
| Date | Event | Price | List to Sale | Price per Sq Ft |
|---|---|---|---|---|
| 11/14/2025 11/14/25 | Sold | $920,000 | +0.5% | $390 / Sq Ft |
| 10/12/2025 10/12/25 | Pending | -- | -- | -- |
| 10/08/2025 10/08/25 | For Sale | $915,000 | -- | $388 / Sq Ft |
| Year | Tax Paid | Tax Assessment Tax Assessment Total Assessment is a certain percentage of the fair market value that is determined by local assessors to be the total taxable value of land and additions on the property. | Land | Improvement |
|---|---|---|---|---|
| 2025 | $8,767 | $733,000 | $426,700 | $306,300 |
| 2024 | $8,443 | $688,700 | $401,600 | $287,100 |
| 2023 | $8,725 | $690,300 | $386,400 | $303,900 |
| 2022 | $8,459 | $634,100 | $351,100 | $283,000 |
| 2021 | $8,118 | $596,500 | $331,100 | $265,400 |
| 2020 | $7,913 | $581,400 | $316,000 | $265,400 |
| 2019 | $7,390 | $581,400 | $316,000 | $265,400 |
| 2018 | $4,497 | $493,400 | $301,000 | $192,400 |
| 2017 | $6,003 | $445,000 | $256,200 | $188,800 |
| 2016 | $5,731 | $422,300 | $235,200 | $187,100 |
| 2015 | $5,593 | $404,700 | $235,200 | $169,500 |
D
Seller's Agent in 2025
Doris Grandinetti
Concierge Real Estate, LLC
(617) 803-7702
2 in this area
40 Total Sales

Buyer's Agent in 2025
Marilyn Green
RE/MAX
(508) 509-4775
4 in this area
159 Total Sales
Source: MLS Property Information Network (MLS PIN)
MLS Number: 73441483
APN: NATI-000012-000000-000046
Disclaimer: Certain information contained herein is derived from information provided by parties other than Homes.com. All information provided is deemed reliable, but is not guaranteed to be accurate and should be independently verified.
![]() The property listing data and information, or the Images, set forth herein were provided to MLS Property Information Network, Inc. from third party sources, including sellers, lessors and public records, and were compiled by MLS Property Information Network, Inc. The property listing data and information, and the Images, are for the personal, non-commercial use of consumers having a good faith interest in purchasing or leasing listed properties of the type displayed to them and may not be used for any purpose other than to identify prospective properties which such consumers may have a good faith interest in purchasing or leasing. MLS Property Information Network, Inc. and its subscribers disclaim any and all representations and warranties as to the accuracy of the property listing data and information, or as to the accuracy of any of the Images, set forth herein.
The property listing data and information, or the Images, set forth herein were provided to MLS Property Information Network, Inc. from third party sources, including sellers, lessors and public records, and were compiled by MLS Property Information Network, Inc. The property listing data and information, and the Images, are for the personal, non-commercial use of consumers having a good faith interest in purchasing or leasing listed properties of the type displayed to them and may not be used for any purpose other than to identify prospective properties which such consumers may have a good faith interest in purchasing or leasing. MLS Property Information Network, Inc. and its subscribers disclaim any and all representations and warranties as to the accuracy of the property listing data and information, or as to the accuracy of any of the Images, set forth herein.
Ask me questions while you tour the home.