Estimated Value: $229,000 - $255,000
4
Beds
2
Baths
1,525
Sq Ft
$158/Sq Ft
Est. Value
About This Home
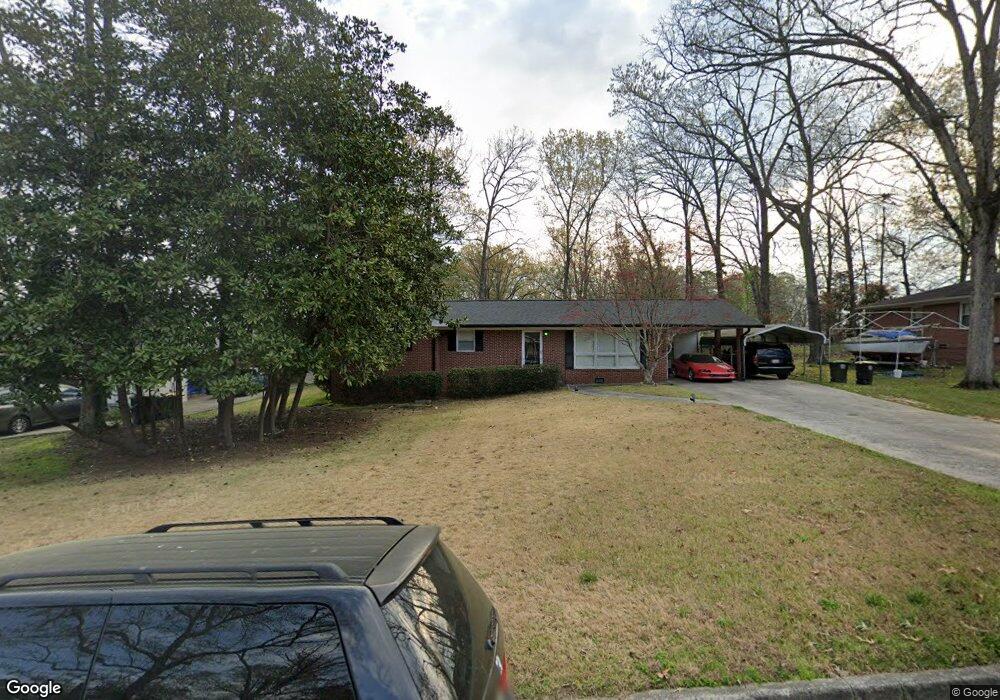
This home is located at 5 Crestridge Dr SW, Rome, GA 30165 and is currently estimated at $241,042, approximately $158 per square foot. 5 Crestridge Dr SW is a home located in Floyd County with nearby schools including Rome High School.
Ownership History
Date
Name
Owned For
Owner Type
Purchase Details
Closed on
Oct 31, 2022
Sold by
Martin Kanousha D
Bought by
Martin Kanousha D and Martin Gary L
Current Estimated Value
Home Financials for this Owner
Home Financials are based on the most recent Mortgage that was taken out on this home.
Original Mortgage
$215,033
Outstanding Balance
$208,328
Interest Rate
6.92%
Mortgage Type
FHA
Estimated Equity
$32,714
Purchase Details
Closed on
Aug 18, 2012
Sold by
Snowden Garner
Bought by
Chatman Charlotte Darlene
Purchase Details
Closed on
Jan 4, 2002
Sold by
Vancuren Tara M
Bought by
Rhinehart Gary D and Rhin Christina M
Purchase Details
Closed on
Oct 31, 2000
Sold by
Godfreey Mary Boggs
Bought by
Vancuren Tara M
Purchase Details
Closed on
Apr 7, 1983
Sold by
Godfrey Chas H
Bought by
Godfreey Mary Boggs
Purchase Details
Closed on
Apr 5, 1973
Sold by
Greer Donald H
Bought by
Godfrey Chas H
Purchase Details
Closed on
Jan 1, 1962
Sold by
Wilson J L
Bought by
Greer Donald H
Purchase Details
Closed on
Jan 1, 1901
Bought by
Wilson J L
Create a Home Valuation Report for This Property
The Home Valuation Report is an in-depth analysis detailing your home's value as well as a comparison with similar homes in the area
Home Values in the Area
Average Home Value in this Area
Purchase History
| Date | Buyer | Sale Price | Title Company |
|---|---|---|---|
| Martin Kanousha D | -- | -- | |
| Martin Kanousha D | $219,000 | -- | |
| Chatman Charlotte Darlene | -- | -- | |
| Rhinehart Gary D | $117,700 | -- | |
| Vancuren Tara M | $95,500 | -- | |
| Godfreey Mary Boggs | -- | -- | |
| Godfrey Chas H | $13,900 | -- | |
| Greer Donald H | -- | -- | |
| Wilson J L | -- | -- |
Source: Public Records
Mortgage History
| Date | Status | Borrower | Loan Amount |
|---|---|---|---|
| Open | Martin Kanousha D | $215,033 |
Source: Public Records
Tax History Compared to Growth
Tax History
| Year | Tax Paid | Tax Assessment Tax Assessment Total Assessment is a certain percentage of the fair market value that is determined by local assessors to be the total taxable value of land and additions on the property. | Land | Improvement |
|---|---|---|---|---|
| 2024 | $3,169 | $81,575 | $11,662 | $69,913 |
| 2023 | $2,889 | $73,862 | $10,534 | $63,328 |
| 2022 | $1,830 | $60,351 | $8,653 | $51,698 |
| 2021 | $1,763 | $54,829 | $8,653 | $46,176 |
| 2020 | $1,691 | $49,983 | $6,584 | $43,399 |
| 2019 | $1,627 | $47,206 | $6,584 | $40,622 |
| 2018 | $1,579 | $44,461 | $6,584 | $37,877 |
| 2017 | $1,537 | $42,807 | $6,584 | $36,223 |
| 2016 | $1,332 | $37,160 | $6,560 | $30,600 |
| 2015 | $1,217 | $37,160 | $6,560 | $30,600 |
| 2014 | $1,217 | $35,951 | $6,560 | $29,391 |
Source: Public Records
Map
Nearby Homes
- 106 Coker Dr SW
- 1 Westlyn Dr SW
- 0 Westlyn Dr Unit 10599621
- 0 Westlyn Dr Unit 7645405
- 30 Westover Dr SW
- 111 Deerbrook Dr SW
- 9 Ladonna Place SW
- 15 Ladonna Place SW
- 0 Lovell Ln Unit 7662536
- 0 Lovell Ln Unit 10620627
- 3 Oak Ridge Ct NE
- 3 Lovell Ln SW
- 5 Ridge Dr SW
- 25 Ridge Dr SW
- 2 Thornwood Dr SW
- 106 Kenwood Dr SW
- 200 Coosawattee Ave SW
- 216 Coosawattee Ave SW
- 2604 Shorter Ave NW
- 121 Kenwood Dr SW
- 7 Crestridge Dr SW
- 3 Crestridge Dr SW
- 0 Crestridge Dr SW Unit 7396989
- 0 Crestridge Dr SW Unit 8104864
- 0 Crestridge Dr SW Unit 7572642
- 0 Crestridge Dr SW Unit 7542116
- 0 Crestridge Dr SW Unit 7326395
- 0 Crestridge Dr SW Unit 7466962
- 0 Crestridge Dr SW Unit 7386121
- 0 Crestridge Dr SW Unit 7202959
- 0 Crestridge Dr SW Unit 3220450
- 104 Coker Dr SW
- 102 Coker Dr SW
- 9 Crestridge Dr SW
- 1 Crestridge Dr SW
- 8 Crestridge Dr SW
- 4 Crestridge Dr SW
- 1 Greenleaf Dr SW
- 10 Crestridge Dr SW
- 108 Coker Dr SW