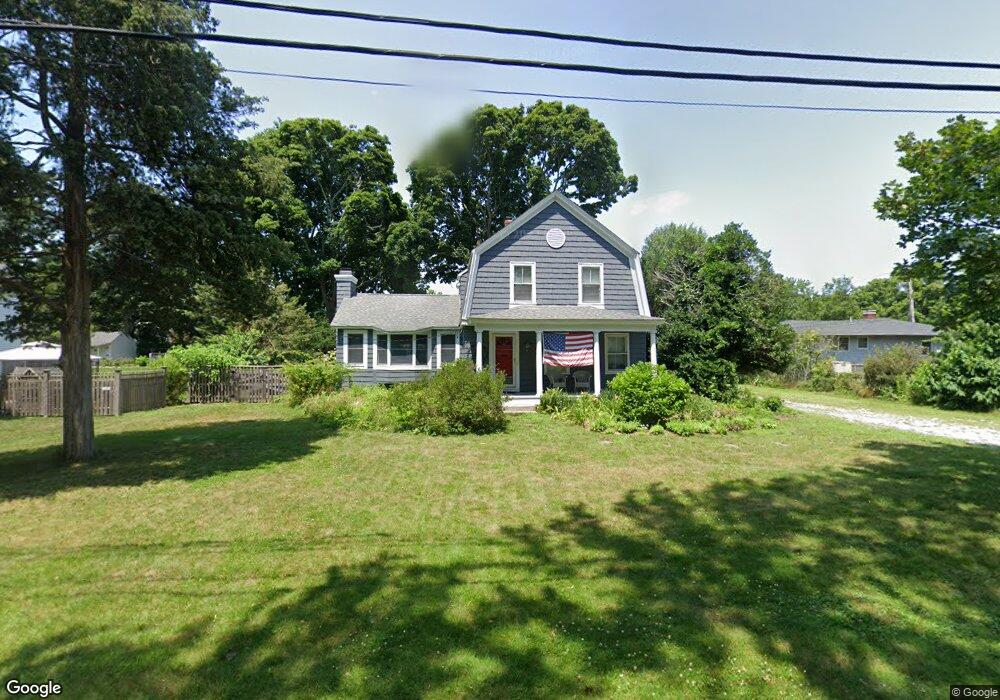
5 Crossways Barrington, RI 02806
Hampden Meadows NeighborhoodEstimated Value: $821,000 - $1,161,614
3
Beds
2
Baths
1,868
Sq Ft
$517/Sq Ft
Est. Value
About This Home
This home is located at 5 Crossways, Barrington, RI 02806 and is currently estimated at $965,654, approximately $516 per square foot. 5 Crossways is a home located in Bristol County with nearby schools including Barrington High School, Highlander Charter Middle and High School, and East Bay Career Academy.
Ownership History
Date
Name
Owned For
Owner Type
Purchase Details
Closed on
Jun 27, 1997
Sold by
Hanrahan David P and Beaver Kendra L
Bought by
Zingg Christopher D and Marshall Amanda S
Current Estimated Value
Home Financials for this Owner
Home Financials are based on the most recent Mortgage that was taken out on this home.
Original Mortgage
$160,000
Interest Rate
7.81%
Mortgage Type
Commercial
Create a Home Valuation Report for This Property
The Home Valuation Report is an in-depth analysis detailing your home's value as well as a comparison with similar homes in the area
Home Values in the Area
Average Home Value in this Area
Purchase History
| Date | Buyer | Sale Price | Title Company |
|---|---|---|---|
| Zingg Christopher D | $210,000 | -- |
Source: Public Records
Mortgage History
| Date | Status | Borrower | Loan Amount |
|---|---|---|---|
| Open | Zingg Christopher D | $20,000 | |
| Open | Zingg Christopher D | $200,000 | |
| Closed | Zingg Christopher D | $158,500 | |
| Closed | Zingg Christopher D | $160,000 |
Source: Public Records
Tax History
| Year | Tax Paid | Tax Assessment Tax Assessment Total Assessment is a certain percentage of the fair market value that is determined by local assessors to be the total taxable value of land and additions on the property. | Land | Improvement |
|---|---|---|---|---|
| 2025 | $11,904 | $776,000 | $326,000 | $450,000 |
| 2024 | $11,284 | $765,000 | $326,000 | $439,000 |
| 2023 | $11,490 | $566,000 | $202,000 | $364,000 |
| 2022 | $11,122 | $566,000 | $202,000 | $364,000 |
| 2021 | $10,839 | $566,000 | $202,000 | $364,000 |
| 2020 | $11,244 | $538,000 | $175,000 | $363,000 |
| 2019 | $10,814 | $538,000 | $175,000 | $363,000 |
| 2018 | $10,491 | $538,000 | $175,000 | $363,000 |
| 2017 | $9,132 | $456,600 | $174,100 | $282,500 |
| 2016 | $8,424 | $456,600 | $174,100 | $282,500 |
| 2015 | $8,333 | $456,600 | $174,100 | $282,500 |
| 2014 | $8,526 | $465,900 | $174,100 | $291,800 |
Source: Public Records
Map
Nearby Homes
Your Personal Tour Guide
Ask me questions while you tour the home.