5 Crown Ct Unit 398BB Ellijay, GA 30540
Estimated Value: $430,223 - $521,000
3
Beds
4
Baths
2,146
Sq Ft
$216/Sq Ft
Est. Value
About This Home
This home is located at 5 Crown Ct Unit 398BB, Ellijay, GA 30540 and is currently estimated at $463,556, approximately $216 per square foot. 5 Crown Ct Unit 398BB is a home located in Gilmer County with nearby schools including Ellijay Elementary School, Clear Creek Elementary School, and Clear Creek Middle School.
Ownership History
Date
Name
Owned For
Owner Type
Purchase Details
Closed on
Aug 1, 2017
Sold by
Raschdorf Richard
Bought by
Marchant Edward and Marchant Marchant
Current Estimated Value
Purchase Details
Closed on
Jul 19, 2006
Sold by
Oliverio John E
Bought by
Raschdorf Richard
Purchase Details
Closed on
Apr 19, 2005
Sold by
Rtd Contracting Inc
Bought by
Oliverio John
Purchase Details
Closed on
May 30, 2002
Sold by
Appalachian Heritage
Bought by
Flint Timber Lp
Purchase Details
Closed on
Aug 1, 1990
Bought by
Appalachian Heritage
Purchase Details
Closed on
Feb 1, 1989
Bought by
Appalachian Heritage
Purchase Details
Closed on
May 1, 1982
Bought by
Appalachian Heritage
Create a Home Valuation Report for This Property
The Home Valuation Report is an in-depth analysis detailing your home's value as well as a comparison with similar homes in the area
Home Values in the Area
Average Home Value in this Area
Purchase History
| Date | Buyer | Sale Price | Title Company |
|---|---|---|---|
| Marchant Edward | $210,000 | -- | |
| Raschdorf Richard | $176,000 | -- | |
| Oliverio John | -- | -- | |
| Rtd Contracting Inc | $6,800 | -- | |
| Flint Timber Lp | $447,100 | -- | |
| Appalachian Heritage | -- | -- | |
| Appalachian Heritage | -- | -- | |
| Appalachian Heritage | -- | -- |
Source: Public Records
Tax History Compared to Growth
Tax History
| Year | Tax Paid | Tax Assessment Tax Assessment Total Assessment is a certain percentage of the fair market value that is determined by local assessors to be the total taxable value of land and additions on the property. | Land | Improvement |
|---|---|---|---|---|
| 2024 | $2,878 | $185,720 | $4,240 | $181,480 |
| 2023 | $2,722 | $170,160 | $3,640 | $166,520 |
| 2022 | $2,582 | $146,720 | $2,480 | $144,240 |
| 2021 | $2,355 | $118,680 | $2,480 | $116,200 |
| 2020 | $2,127 | $96,720 | $2,400 | $94,320 |
| 2019 | $2,303 | $101,680 | $2,520 | $99,160 |
| 2018 | $1,927 | $101,680 | $2,520 | $99,160 |
| 2017 | $606 | $88,480 | $3,000 | $85,480 |
| 2016 | $606 | $84,960 | $2,000 | $82,960 |
| 2015 | $1,802 | $73,080 | $1,800 | $71,280 |
| 2014 | $1,677 | $65,440 | $1,800 | $63,640 |
| 2013 | -- | $60,680 | $1,800 | $58,880 |
Source: Public Records
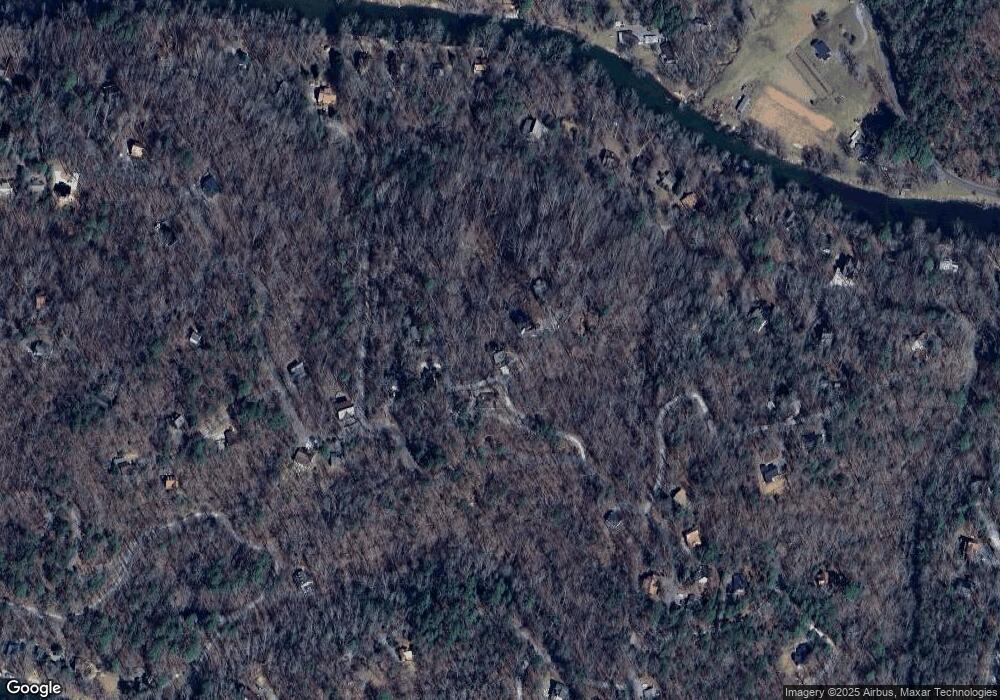
Map
Nearby Homes
- 21 Crown Ct Unit 399
- 21 Crown Ct
- 854 Navaho Way Unit 5700
- 661 Navaho Way Unit 5631
- 896 Navaho Way
- 688 Navaho Way
- 302 Zenith Trail
- 0 Double Knob Unit 10618992
- 253 Zenith Trail
- Lot #385 Zenith Trail
- LT 264 Zenith Trail
- 0 Cataula Ct Unit 7652426
- LOT 638 Dewey Dr
- 821 Navaho Way
- 45 1st St
- 0 Legion Rd Unit 241 ACRES
- 54 1st St
- 228 Centergate Dr
- 3517 Darian Way
- 0 Darian Way Unit 10596805
- 5 Crown Ct
- 399 Crown Ct
- LOT 402 Crown Ct
- 403 Crown Ct
- 49 Eden Dr Unit 5524
- 49 Eden Dr Unit 5524
- 0 Crown Ct Unit 414818
- 0 Crown Ct Unit 40 8017321
- 19 Chime Ct
- 27 Chime Ct
- 50 Crown Ct
- 566 Zenith Trail
- TBD Crown Ct
- 373 Lot 373 Zenith Trail
- 436 Manor Ct
- 375 Zenith Trail
- 337 Zenith Trail
- 319 Zenith Trail
- 0 Floral Ct Unit 440-441 8292813
- 0 Floral Ct Unit 8849377