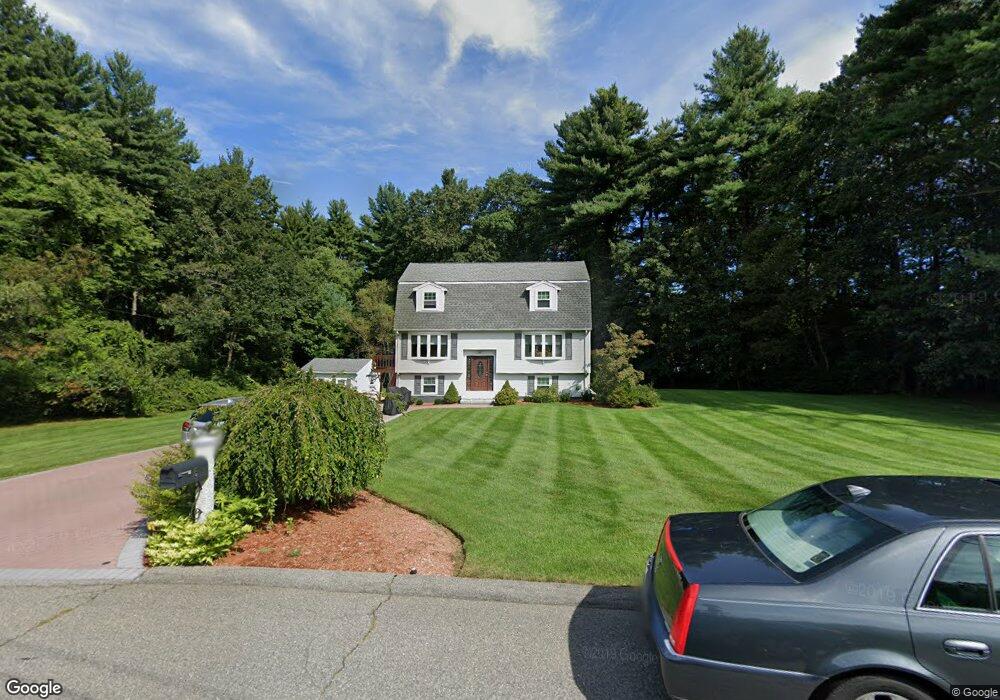
5 Daniel Finn Cir Billerica, MA 01821
Pinehurst NeighborhoodEstimated Value: $803,000 - $887,000
3
Beds
2
Baths
2,440
Sq Ft
$348/Sq Ft
Est. Value
About This Home
This home is located at 5 Daniel Finn Cir, Billerica, MA 01821 and is currently estimated at $850,233, approximately $348 per square foot. 5 Daniel Finn Cir is a home located in Middlesex County with nearby schools including Billerica Memorial High School and Burlington Montessori School.
Ownership History
Date
Name
Owned For
Owner Type
Purchase Details
Closed on
Nov 24, 2022
Sold by
Kelley Daniel and Kelley Rita
Bought by
Kelley Lt and Kelley
Current Estimated Value
Home Financials for this Owner
Home Financials are based on the most recent Mortgage that was taken out on this home.
Original Mortgage
$307,610
Outstanding Balance
$284,809
Interest Rate
2.7%
Mortgage Type
Stand Alone Refi Refinance Of Original Loan
Estimated Equity
$565,424
Purchase Details
Closed on
Mar 5, 2018
Sold by
Kelley Lt
Bought by
Kelley Lt
Create a Home Valuation Report for This Property
The Home Valuation Report is an in-depth analysis detailing your home's value as well as a comparison with similar homes in the area
Home Values in the Area
Average Home Value in this Area
Purchase History
| Date | Buyer | Sale Price | Title Company |
|---|---|---|---|
| Kelley Lt | -- | None Available | |
| Kelley Lt | -- | None Available | |
| Kelley Rita | -- | None Available | |
| Kelley Lt | -- | -- | |
| Kelley Lt | -- | -- |
Source: Public Records
Mortgage History
| Date | Status | Borrower | Loan Amount |
|---|---|---|---|
| Open | Kelley Lt | $307,610 | |
| Closed | Kelley Lt | $307,610 | |
| Previous Owner | Kelley Lt | $283,413 | |
| Previous Owner | Kelley Lt | $134,000 |
Source: Public Records
Tax History Compared to Growth
Tax History
| Year | Tax Paid | Tax Assessment Tax Assessment Total Assessment is a certain percentage of the fair market value that is determined by local assessors to be the total taxable value of land and additions on the property. | Land | Improvement |
|---|---|---|---|---|
| 2025 | $8,570 | $753,700 | $382,100 | $371,600 |
| 2024 | $8,264 | $732,000 | $374,100 | $357,900 |
| 2023 | $7,923 | $667,500 | $327,500 | $340,000 |
| 2022 | $7,119 | $563,200 | $273,500 | $289,700 |
| 2021 | $6,842 | $526,300 | $245,600 | $280,700 |
| 2020 | $6,672 | $513,600 | $236,000 | $277,600 |
| 2019 | $6,416 | $476,000 | $231,700 | $244,300 |
| 2018 | $6,245 | $440,100 | $218,600 | $221,500 |
| 2017 | $5,859 | $415,800 | $205,500 | $210,300 |
| 2016 | $5,693 | $402,600 | $196,800 | $205,800 |
| 2015 | $5,620 | $400,300 | $196,800 | $203,500 |
| 2014 | $5,567 | $389,600 | $183,400 | $206,200 |
Source: Public Records
Map
Nearby Homes