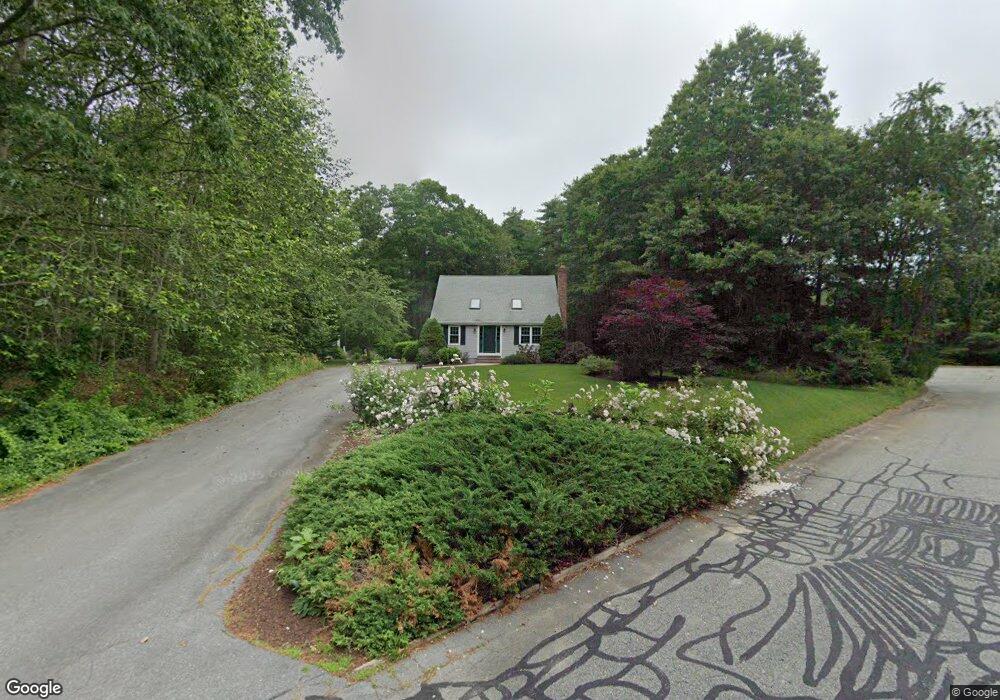
5 Darling Way East Freetown, MA 02717
Estimated Value: $600,418 - $708,000
2
Beds
2
Baths
1,824
Sq Ft
$349/Sq Ft
Est. Value
About This Home
This home is located at 5 Darling Way, East Freetown, MA 02717 and is currently estimated at $636,105, approximately $348 per square foot. 5 Darling Way is a home located in Bristol County with nearby schools including Freetown Elementary School, George R Austin Intermediate School, and Freetown-Lakeville Middle School.
Ownership History
Date
Name
Owned For
Owner Type
Purchase Details
Closed on
Oct 24, 2025
Sold by
Bruno Michael J and Bruno Cathleen
Bought by
Bruno
Current Estimated Value
Purchase Details
Closed on
May 10, 1991
Sold by
Stinus Vincent J and Stinus Alice J
Bought by
Bruno Michael J and Bruno Cathleen A
Create a Home Valuation Report for This Property
The Home Valuation Report is an in-depth analysis detailing your home's value as well as a comparison with similar homes in the area
Home Values in the Area
Average Home Value in this Area
Purchase History
| Date | Buyer | Sale Price | Title Company |
|---|---|---|---|
| Bruno | -- | -- | |
| Bruno Michael J | $49,000 | -- |
Source: Public Records
Mortgage History
| Date | Status | Borrower | Loan Amount |
|---|---|---|---|
| Previous Owner | Bruno Michael J | $125,000 | |
| Previous Owner | Bruno Michael J | $25,000 | |
| Previous Owner | Bruno Michael J | $85,000 | |
| Previous Owner | Bruno Michael J | $100,000 |
Source: Public Records
Tax History Compared to Growth
Tax History
| Year | Tax Paid | Tax Assessment Tax Assessment Total Assessment is a certain percentage of the fair market value that is determined by local assessors to be the total taxable value of land and additions on the property. | Land | Improvement |
|---|---|---|---|---|
| 2025 | $5,276 | $532,400 | $187,400 | $345,000 |
| 2024 | $5,283 | $506,500 | $176,700 | $329,800 |
| 2023 | $5,134 | $479,400 | $159,200 | $320,200 |
| 2022 | $4,901 | $406,400 | $134,800 | $271,600 |
| 2021 | $4,634 | $364,900 | $122,600 | $242,300 |
| 2020 | $4,579 | $351,700 | $117,900 | $233,800 |
| 2019 | $4,334 | $329,600 | $112,300 | $217,300 |
| 2018 | $4,133 | $310,500 | $112,300 | $198,200 |
| 2017 | $4,020 | $301,800 | $112,300 | $189,500 |
| 2016 | $3,837 | $293,100 | $109,100 | $184,000 |
| 2015 | $3,766 | $291,900 | $109,100 | $182,800 |
| 2014 | $3,647 | $289,200 | $106,800 | $182,400 |
Source: Public Records
Map
Nearby Homes
- 9 Paul Ave
- 3 Abraham Ave
- 0 Costa Dr
- 269 Middleboro Rd
- 4597 Acushnet Ave
- 28 Cedar Hill Dr
- 247 Braley Hill Rd
- 120 Hackett Ave
- 168 Keene Rd
- 60 Lakeside Ave
- 319 Northwest St
- 1069 Cherokee St
- 1475 Braley Rd Unit 17
- 144 Chace Rd
- 16 Swallow St
- 13 Luscomb Ln
- 24 Bells Brook Rd
- 15 Morrison Way
- 5 Freetown St
- 0 Keene Rd Unit 73459818