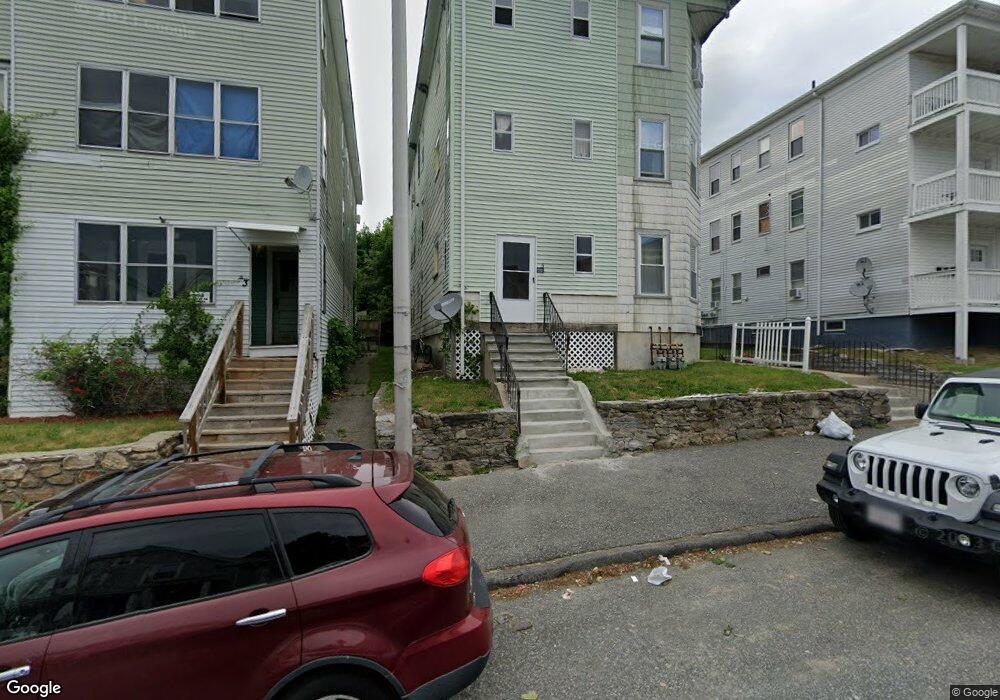
5 Dartmouth St Worcester, MA 01604
Hamilton NeighborhoodEstimated Value: $609,281 - $686,000
9
Beds
3
Baths
3,606
Sq Ft
$183/Sq Ft
Est. Value
About This Home
This home is located at 5 Dartmouth St, Worcester, MA 01604 and is currently estimated at $660,820, approximately $183 per square foot. 5 Dartmouth St is a home located in Worcester County with nearby schools including Jacob Hiatt Magnet School, Chandler Magnet, and Grafton Street.
Ownership History
Date
Name
Owned For
Owner Type
Purchase Details
Closed on
Jul 9, 2021
Sold by
Cipro Angelo V
Bought by
Rasheed Ashfaq and Javeed Sheema
Current Estimated Value
Home Financials for this Owner
Home Financials are based on the most recent Mortgage that was taken out on this home.
Original Mortgage
$288,000
Outstanding Balance
$261,315
Interest Rate
2.9%
Mortgage Type
Purchase Money Mortgage
Estimated Equity
$399,505
Purchase Details
Closed on
Jun 17, 2011
Sold by
Cipro Patrick and Cipro Gewn
Bought by
Cipro Angelo
Home Financials for this Owner
Home Financials are based on the most recent Mortgage that was taken out on this home.
Original Mortgage
$17,138
Interest Rate
4.74%
Mortgage Type
Purchase Money Mortgage
Purchase Details
Closed on
Jan 31, 1990
Sold by
Cipro Angelo
Bought by
Cipro Patrick
Home Financials for this Owner
Home Financials are based on the most recent Mortgage that was taken out on this home.
Original Mortgage
$60,000
Interest Rate
9.59%
Mortgage Type
Purchase Money Mortgage
Create a Home Valuation Report for This Property
The Home Valuation Report is an in-depth analysis detailing your home's value as well as a comparison with similar homes in the area
Home Values in the Area
Average Home Value in this Area
Purchase History
| Date | Buyer | Sale Price | Title Company |
|---|---|---|---|
| Rasheed Ashfaq | $480,000 | None Available | |
| Cipro Angelo | $176,000 | -- | |
| Cipro Patrick | $75,000 | -- |
Source: Public Records
Mortgage History
| Date | Status | Borrower | Loan Amount |
|---|---|---|---|
| Open | Rasheed Ashfaq | $288,000 | |
| Previous Owner | Cipro Angelo | $17,138 | |
| Previous Owner | Cipro Patrick | $60,000 |
Source: Public Records
Tax History Compared to Growth
Tax History
| Year | Tax Paid | Tax Assessment Tax Assessment Total Assessment is a certain percentage of the fair market value that is determined by local assessors to be the total taxable value of land and additions on the property. | Land | Improvement |
|---|---|---|---|---|
| 2025 | $6,356 | $481,900 | $97,900 | $384,000 |
| 2024 | $5,911 | $429,900 | $97,900 | $332,000 |
| 2023 | $5,638 | $393,200 | $85,100 | $308,100 |
| 2022 | $4,899 | $322,100 | $68,100 | $254,000 |
| 2021 | $4,751 | $291,800 | $54,500 | $237,300 |
| 2020 | $4,422 | $260,100 | $54,500 | $205,600 |
| 2019 | $3,442 | $191,200 | $49,000 | $142,200 |
| 2018 | $3,391 | $179,300 | $49,000 | $130,300 |
| 2017 | $3,212 | $167,100 | $49,000 | $118,100 |
| 2016 | $3,011 | $146,100 | $36,400 | $109,700 |
| 2015 | $2,932 | $146,100 | $36,400 | $109,700 |
| 2014 | $2,855 | $146,100 | $36,400 | $109,700 |
Source: Public Records
Map
Nearby Homes
- 5 Dartmouth St Unit 3
- 5 Dartmouth St Unit 1
- 5 Dartmouth St Unit 2
- 3 Dartmouth St
- 7 Dartmouth St
- 7 Dartmouth St Unit 3
- 100 Plantation St
- 100 Plantation St Unit 2
- 1 Dartmouth St Unit 2
- 1 Dartmouth St Unit 1
- 19 Almont Ave
- 102 Plantation St
- 102 Plantation St Unit 2
- 6 Dartmouth St
- 4 Dartmouth St
- 8 Dartmouth St
- 104 Plantation St
- 104 Plantation St Unit 3
- 25 Almont Ave
- 2 Dartmouth St