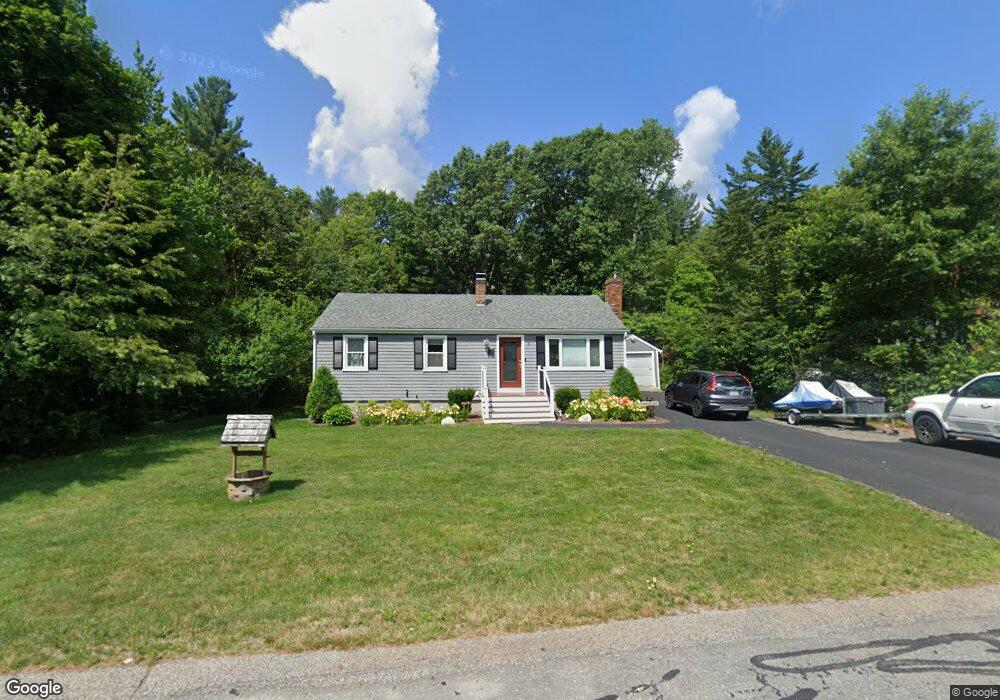
5 Dean St Assonet, MA 02702
Assonet NeighborhoodEstimated Value: $493,572 - $509,000
3
Beds
1
Bath
1,120
Sq Ft
$447/Sq Ft
Est. Value
About This Home
This home is located at 5 Dean St, Assonet, MA 02702 and is currently estimated at $500,643, approximately $447 per square foot. 5 Dean St is a home located in Bristol County with nearby schools including Freetown Elementary School, George R Austin Intermediate School, and Freetown-Lakeville Middle School.
Ownership History
Date
Name
Owned For
Owner Type
Purchase Details
Closed on
Dec 6, 2013
Sold by
Thibault Raymond and Thibault Pauline M
Bought by
Thibault Raymond and Thibault Maria L
Current Estimated Value
Home Financials for this Owner
Home Financials are based on the most recent Mortgage that was taken out on this home.
Original Mortgage
$203,500
Outstanding Balance
$154,533
Interest Rate
4.17%
Mortgage Type
FHA
Estimated Equity
$346,110
Create a Home Valuation Report for This Property
The Home Valuation Report is an in-depth analysis detailing your home's value as well as a comparison with similar homes in the area
Home Values in the Area
Average Home Value in this Area
Purchase History
| Date | Buyer | Sale Price | Title Company |
|---|---|---|---|
| Thibault Raymond | $250,000 | -- | |
| Thibault Raymond | $250,000 | -- |
Source: Public Records
Mortgage History
| Date | Status | Borrower | Loan Amount |
|---|---|---|---|
| Open | Thibault Raymond | $203,500 | |
| Closed | Thibault Raymond | $203,500 |
Source: Public Records
Tax History Compared to Growth
Tax History
| Year | Tax Paid | Tax Assessment Tax Assessment Total Assessment is a certain percentage of the fair market value that is determined by local assessors to be the total taxable value of land and additions on the property. | Land | Improvement |
|---|---|---|---|---|
| 2025 | $4,014 | $405,000 | $175,500 | $229,500 |
| 2024 | $3,985 | $382,100 | $165,500 | $216,600 |
| 2023 | $3,881 | $362,400 | $149,100 | $213,300 |
| 2022 | $3,700 | $306,800 | $126,300 | $180,500 |
| 2021 | $3,580 | $281,900 | $114,800 | $167,100 |
| 2020 | $3,505 | $269,200 | $110,500 | $158,700 |
| 2019 | $3,318 | $252,300 | $105,200 | $147,100 |
| 2018 | $3,182 | $239,100 | $105,200 | $133,900 |
| 2017 | $3,104 | $233,000 | $105,200 | $127,800 |
| 2016 | $2,920 | $223,100 | $102,200 | $120,900 |
| 2015 | $2,847 | $220,700 | $102,200 | $118,500 |
| 2014 | $2,672 | $211,900 | $100,100 | $111,800 |
Source: Public Records
Map
Nearby Homes
- 6 Weetamoe Dr
- 1 Elm St
- 5 Hadley Heights Way
- 16 Water St Unit A
- 16 Water St Unit C
- 16 Water St Unit B
- 16 Water St Unit D
- 4 Hadley Heights Way
- 20 Slab Bridge Rd
- 37 Simpson Ln
- 22 Freemens Cir
- 52 Anthony St
- 17 E Public St
- 42 High St
- 7 Eric Dr
- 66 S Main St
- 0 Bayview Ave
- 59 Seymour St
- 125 Bayview Ave
- 7 Great Cedar Crossing