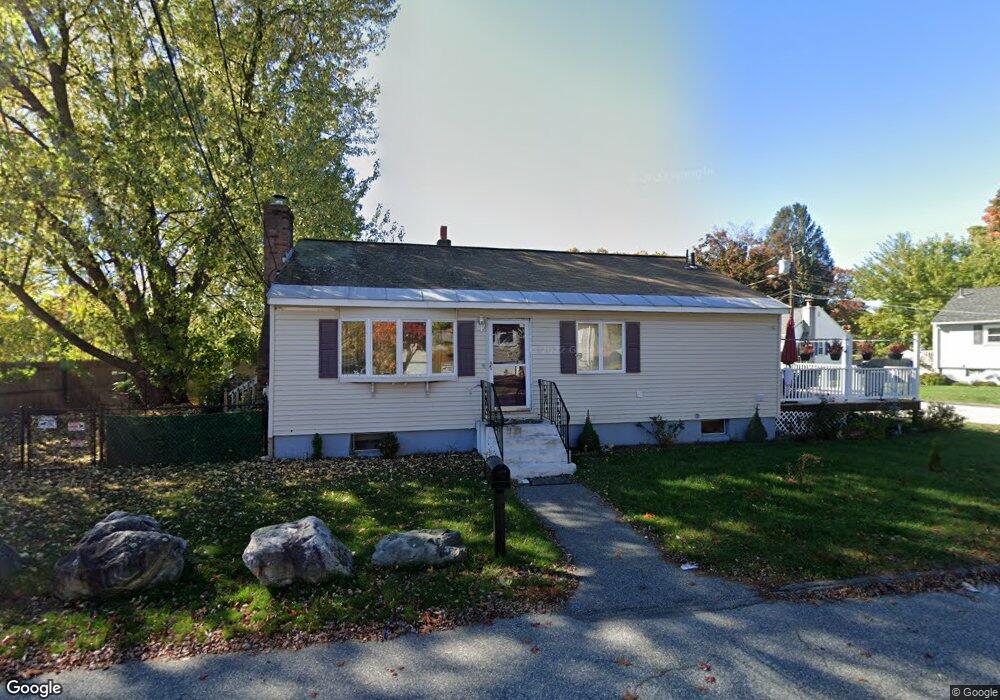
5 Dickie Rd Woburn, MA 01801
North Woburn NeighborhoodEstimated Value: $532,000 - $753,000
5
Beds
2
Baths
1,600
Sq Ft
$393/Sq Ft
Est. Value
About This Home
This home is located at 5 Dickie Rd, Woburn, MA 01801 and is currently estimated at $629,219, approximately $393 per square foot. 5 Dickie Rd is a home located in Middlesex County with nearby schools including Linscott-Rumford Elementary School, John F. Kennedy Middle School, and Woburn High School.
Ownership History
Date
Name
Owned For
Owner Type
Purchase Details
Closed on
Jan 12, 2026
Sold by
Rollins Bruce Edward Est and Rollins
Bought by
Rollins Maria
Current Estimated Value
Purchase Details
Closed on
Sep 15, 2009
Sold by
Derosa Nicole
Bought by
Rollins Bruce E
Home Financials for this Owner
Home Financials are based on the most recent Mortgage that was taken out on this home.
Original Mortgage
$100,000
Interest Rate
5.36%
Mortgage Type
Purchase Money Mortgage
Purchase Details
Closed on
Sep 25, 2006
Sold by
Antonelli Frank A and Antonelli Sandra L
Bought by
Derosa Nicole
Create a Home Valuation Report for This Property
The Home Valuation Report is an in-depth analysis detailing your home's value as well as a comparison with similar homes in the area
Home Values in the Area
Average Home Value in this Area
Purchase History
| Date | Buyer | Sale Price | Title Company |
|---|---|---|---|
| Rollins Maria | -- | -- | |
| Rollins Bruce E | $229,900 | -- | |
| Rollins Bruce E | $229,900 | -- | |
| Rollins Bruce E | $229,900 | -- | |
| Derosa Nicole | $320,000 | -- | |
| Derosa Nicole | $320,000 | -- | |
| Derosa Nicole | $320,000 | -- |
Source: Public Records
Mortgage History
| Date | Status | Borrower | Loan Amount |
|---|---|---|---|
| Previous Owner | Rollins Bruce E | $100,000 |
Source: Public Records
Tax History
| Year | Tax Paid | Tax Assessment Tax Assessment Total Assessment is a certain percentage of the fair market value that is determined by local assessors to be the total taxable value of land and additions on the property. | Land | Improvement |
|---|---|---|---|---|
| 2025 | $4,606 | $539,300 | $258,600 | $280,700 |
| 2024 | $4,190 | $519,900 | $246,300 | $273,600 |
| 2023 | $4,367 | $502,000 | $223,900 | $278,100 |
| 2022 | $4,133 | $442,500 | $194,700 | $247,800 |
| 2021 | $4,042 | $433,200 | $185,400 | $247,800 |
| 2020 | $10,437 | $395,200 | $185,400 | $209,800 |
| 2019 | $6,797 | $359,100 | $176,600 | $182,500 |
| 2018 | $3,343 | $338,000 | $162,000 | $176,000 |
| 2017 | $3,012 | $303,000 | $154,300 | $148,700 |
| 2016 | $2,860 | $284,600 | $144,300 | $140,300 |
| 2015 | $2,798 | $275,100 | $134,800 | $140,300 |
| 2014 | $2,755 | $263,900 | $134,800 | $129,100 |
Source: Public Records
Map
Nearby Homes
Your Personal Tour Guide
Ask me questions while you tour the home.