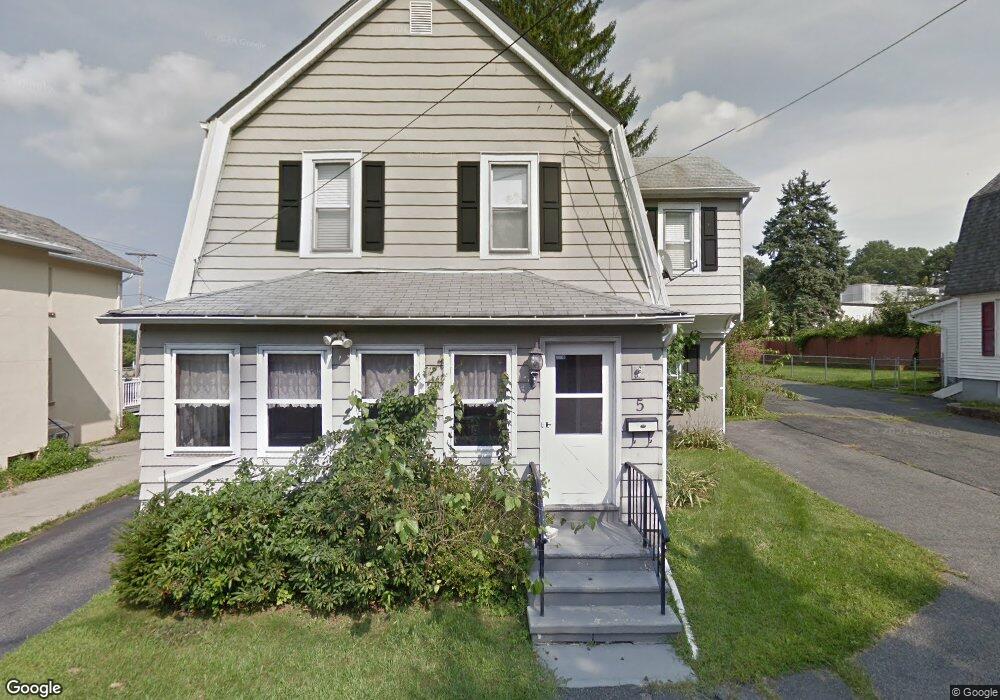
5 Down St Netcong, NJ 07857
Estimated Value: $360,000 - $474,000
Studio
--
Bath
1,372
Sq Ft
$301/Sq Ft
Est. Value
About This Home
This home is located at 5 Down St, Netcong, NJ 07857 and is currently estimated at $413,308, approximately $301 per square foot. 5 Down St is a home located in Morris County with nearby schools including Netcong Elementary School, Lenape Val Regional High School, and St. Therese School.
Ownership History
Date
Name
Owned For
Owner Type
Purchase Details
Closed on
Aug 26, 2014
Sold by
Grogan Eileen
Bought by
Netcong 201 Llc
Current Estimated Value
Purchase Details
Closed on
Jan 23, 2014
Sold by
Grogan Eileen and Grogan Christopher
Bought by
Grogan Eileen
Purchase Details
Closed on
Jun 2, 1997
Sold by
Grogan Michael Wallace and Grogran David Peter
Bought by
Grogan Michael Wallace
Create a Home Valuation Report for This Property
The Home Valuation Report is an in-depth analysis detailing your home's value as well as a comparison with similar homes in the area
Home Values in the Area
Average Home Value in this Area
Purchase History
| Date | Buyer | Sale Price | Title Company |
|---|---|---|---|
| Netcong 201 Llc | $250,000 | None Available | |
| Grogan Eileen | -- | None Available | |
| Grogan Michael Wallace | -- | -- |
Source: Public Records
Tax History
| Year | Tax Paid | Tax Assessment Tax Assessment Total Assessment is a certain percentage of the fair market value that is determined by local assessors to be the total taxable value of land and additions on the property. | Land | Improvement |
|---|---|---|---|---|
| 2025 | $3,099 | $90,700 | $90,600 | $100 |
| 2024 | $3,126 | $90,700 | $90,600 | $100 |
Source: Public Records
Map
Nearby Homes
Your Personal Tour Guide
Ask me questions while you tour the home.