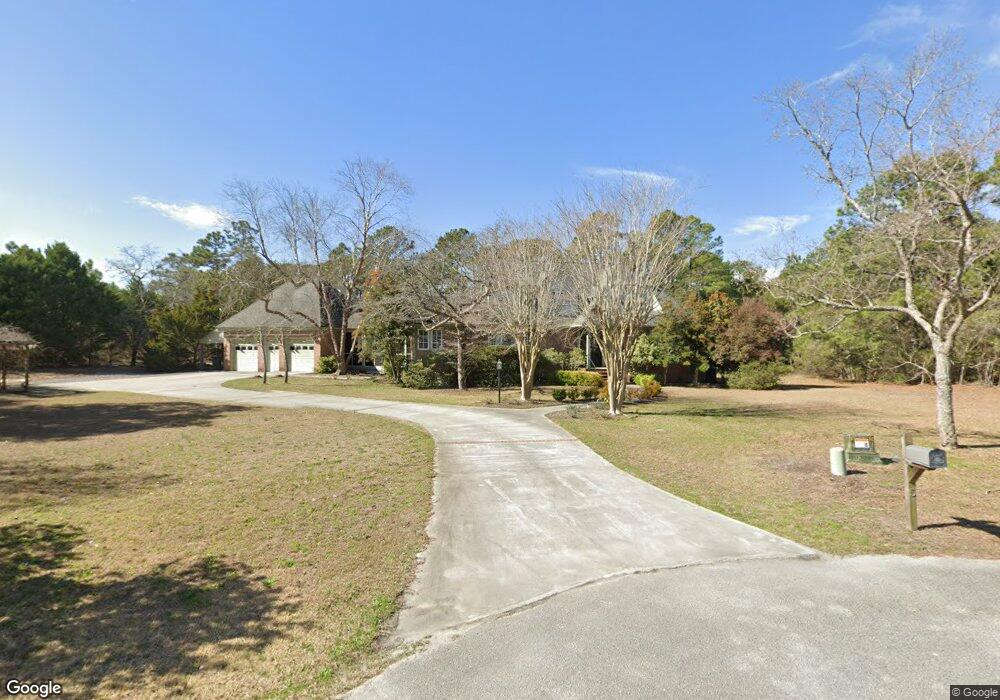
5 Downing Ct Southport, NC 28461
Estimated Value: $730,614 - $850,000
3
Beds
4
Baths
3,118
Sq Ft
$261/Sq Ft
Est. Value
About This Home
This home is located at 5 Downing Ct, Southport, NC 28461 and is currently estimated at $813,154, approximately $260 per square foot. 5 Downing Ct is a home located in Brunswick County with nearby schools including Southport Elementary School, South Brunswick Middle School, and South Brunswick High School.
Ownership History
Date
Name
Owned For
Owner Type
Purchase Details
Closed on
Feb 8, 2017
Sold by
Smith Shane T and Smith Amy D
Bought by
Monday Reed D and Monday Michele L
Current Estimated Value
Purchase Details
Closed on
Sep 13, 2010
Sold by
Powell Linda Faye and Powell Jimmy W
Bought by
Smith Shane T and Smith Amy D
Home Financials for this Owner
Home Financials are based on the most recent Mortgage that was taken out on this home.
Original Mortgage
$300,947
Interest Rate
3.75%
Mortgage Type
FHA
Purchase Details
Closed on
Mar 30, 2006
Sold by
Philips Elizabeth H and Philips Stephen M
Bought by
Powell Linda Faye and Powell Jimmy W
Purchase Details
Closed on
Mar 20, 2006
Sold by
Philips Elizabeth H and Philips Stephen M
Bought by
Powell Linda Faye and Powell Jimmy W
Create a Home Valuation Report for This Property
The Home Valuation Report is an in-depth analysis detailing your home's value as well as a comparison with similar homes in the area
Home Values in the Area
Average Home Value in this Area
Purchase History
| Date | Buyer | Sale Price | Title Company |
|---|---|---|---|
| Monday Reed D | -- | None Available | |
| Smith Shane T | $295,000 | None Available | |
| Powell Linda Faye | $565,000 | None Available | |
| Phillips Elizabeth N | -- | None Available | |
| Powell Linda Faye | $565,000 | None Available |
Source: Public Records
Mortgage History
| Date | Status | Borrower | Loan Amount |
|---|---|---|---|
| Previous Owner | Smith Shane T | $300,947 |
Source: Public Records
Tax History Compared to Growth
Tax History
| Year | Tax Paid | Tax Assessment Tax Assessment Total Assessment is a certain percentage of the fair market value that is determined by local assessors to be the total taxable value of land and additions on the property. | Land | Improvement |
|---|---|---|---|---|
| 2025 | $3,024 | $634,490 | $72,000 | $562,490 |
| 2024 | $3,024 | $634,490 | $72,000 | $562,490 |
| 2023 | $3,355 | $634,490 | $72,000 | $562,490 |
| 2022 | $3,355 | $524,840 | $72,000 | $452,840 |
| 2021 | $3,168 | $524,840 | $72,000 | $452,840 |
| 2020 | $3,168 | $524,840 | $72,000 | $452,840 |
| 2019 | $3,168 | $94,100 | $72,000 | $22,100 |
| 2018 | $2,794 | $99,860 | $72,000 | $27,860 |
| 2017 | $3,046 | $117,860 | $90,000 | $27,860 |
| 2016 | $2,971 | $117,860 | $90,000 | $27,860 |
| 2015 | $2,971 | $508,670 | $90,000 | $418,670 |
| 2014 | $2,245 | $403,064 | $42,000 | $361,064 |
Source: Public Records
Map
Nearby Homes
- 2443 Lake Ridge Dr
- 2273 Crescent Bay Dr
- 2451 Lake Ridge Dr
- 2285 Crescent Bay Dr
- 2478 Lake Ridge Dr
- 2119 Maple Leaf Dr
- 2289 Crescent Bay Dr
- 2482 Lake Ridge Dr
- 2308 Crescent Bay Dr
- 2293 Crescent Bay Dr
- 2499 Lake Ridge Dr
- Marshall Plan at Osprey Landing - Signature
- Kauai Plan at Osprey Landing - Signature
- Helmsley Plan at Osprey Landing - Signature
- McKenzie Plan at Osprey Landing - Signature
- Shoreline Plan at Osprey Landing - Bungalow
- Hadley Plan at Osprey Landing - Village
- Seagrass Plan at Osprey Landing - Bungalow
- Ashton Plan at Osprey Landing - Signature
- Essex Plan at Osprey Landing - Village
- 3 Downing Ct
- 262 Bonnet Way
- 260 Bonnet Way
- 8 Downing Ct
- 264 Bonnet Way SE
- 258 Bonnet Way
- 266 Bonnet Way
- 256 Bonnet Way
- 9 Downing Ct
- 254 Bonnet Way
- 4409 Willow Moss Way
- 268 Bonnet Way SE
- 4407 Willow Moss Way
- 4407 Willow Moss Way Unit 4407
- 1 Forest Oaks Dr
- 4411 Willow Moss Way
- 257 Bonnet Way
- 4405 Willow Moss Way
- 270 Bonnet Way
- 4403 Willow Moss Way