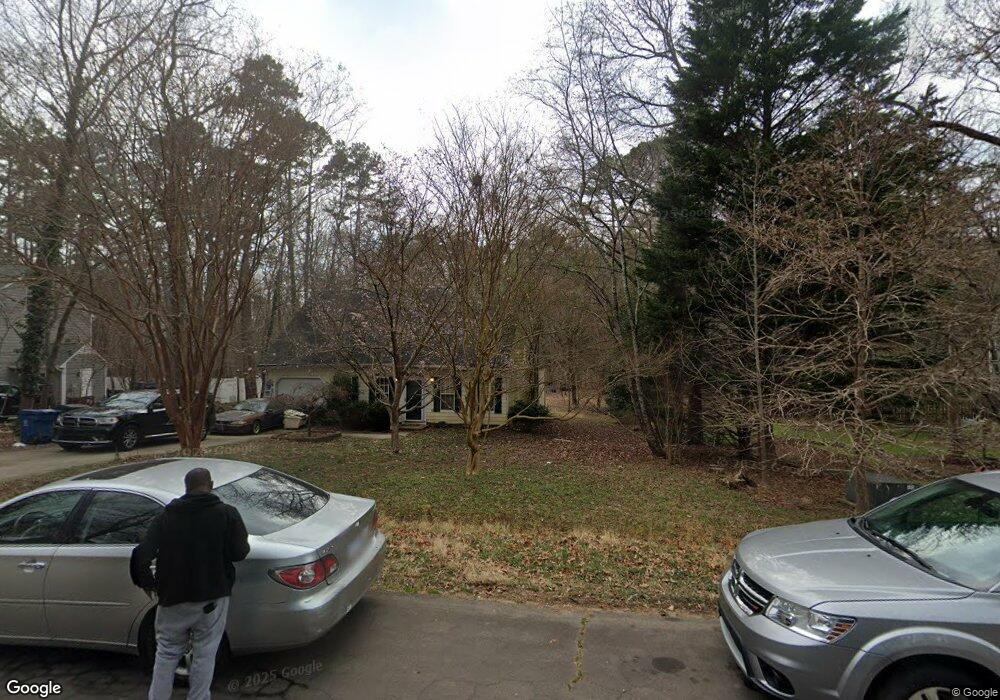
5 Drayton Ct Durham, NC 27712
North Durham NeighborhoodEstimated Value: $367,000 - $390,000
4
Beds
3
Baths
1,875
Sq Ft
$201/Sq Ft
Est. Value
About This Home
This home is located at 5 Drayton Ct, Durham, NC 27712 and is currently estimated at $377,698, approximately $201 per square foot. 5 Drayton Ct is a home located in Durham County with nearby schools including Eno Valley Elementary, George L Carrington Middle, and Northern High School.
Ownership History
Date
Name
Owned For
Owner Type
Purchase Details
Closed on
Feb 4, 2011
Sold by
Bumper Mark Anthony and Bumper Joycelyn M
Bought by
Bumper Mark Anthony
Current Estimated Value
Purchase Details
Closed on
Apr 29, 2010
Sold by
Brunson Patrick R and Brunson Patricia O
Bought by
Bumper Mark Anthony and Bumper Joycelyn M
Home Financials for this Owner
Home Financials are based on the most recent Mortgage that was taken out on this home.
Original Mortgage
$152,192
Outstanding Balance
$103,002
Interest Rate
5.25%
Mortgage Type
FHA
Estimated Equity
$274,696
Purchase Details
Closed on
May 1, 2003
Sold by
Hud
Bought by
Brunson Patrick
Home Financials for this Owner
Home Financials are based on the most recent Mortgage that was taken out on this home.
Original Mortgage
$121,600
Interest Rate
3.87%
Purchase Details
Closed on
May 22, 2002
Sold by
Hester Alton C and Downey Vivian D
Bought by
Hud
Create a Home Valuation Report for This Property
The Home Valuation Report is an in-depth analysis detailing your home's value as well as a comparison with similar homes in the area
Home Values in the Area
Average Home Value in this Area
Purchase History
| Date | Buyer | Sale Price | Title Company |
|---|---|---|---|
| Bumper Mark Anthony | -- | None Available | |
| Bumper Mark Anthony | $155,000 | None Available | |
| Brunson Patrick | -- | -- | |
| Hud | $135,835 | -- |
Source: Public Records
Mortgage History
| Date | Status | Borrower | Loan Amount |
|---|---|---|---|
| Open | Bumper Mark Anthony | $152,192 | |
| Previous Owner | Brunson Patrick | $121,600 |
Source: Public Records
Tax History
| Year | Tax Paid | Tax Assessment Tax Assessment Total Assessment is a certain percentage of the fair market value that is determined by local assessors to be the total taxable value of land and additions on the property. | Land | Improvement |
|---|---|---|---|---|
| 2025 | $3,380 | $340,937 | $86,875 | $254,062 |
| 2024 | $2,976 | $213,323 | $34,850 | $178,473 |
| 2023 | $2,794 | $213,323 | $34,850 | $178,473 |
| 2022 | $2,730 | $213,323 | $34,850 | $178,473 |
| 2021 | $2,718 | $213,323 | $34,850 | $178,473 |
| 2020 | $2,654 | $213,323 | $34,850 | $178,473 |
| 2019 | $2,654 | $213,323 | $34,850 | $178,473 |
| 2018 | $2,398 | $176,769 | $27,880 | $148,889 |
| 2017 | $2,380 | $176,769 | $27,880 | $148,889 |
| 2016 | $2,300 | $176,769 | $27,880 | $148,889 |
| 2015 | $2,307 | $166,623 | $31,924 | $134,699 |
| 2014 | $2,307 | $166,623 | $31,924 | $134,699 |
Source: Public Records
Map
Nearby Homes
- 427 Vivaldi Dr
- 4 Amador Place
- 5502 Ripplebrook Rd
- 5406 Ripplebrook Dr
- 6 Blake Ct
- 600 Birchrun Dr
- 5620 Birch Dr
- 5388 N Roxboro St
- 109 Crestview Dr
- 4518 Paces Ferry Dr
- 310 Mickey Cir
- 5018 Gatewood Dr
- 7 Starwood Ln
- 5023 Pine Trail Dr
- 5022 Green Oak Dr
- 215 Cheryl Ave
- 5805 Prioress Dr
- 5809 Prioress Dr
- 5801 Prioress Dr
- 5005 Gatewood Dr
- 3 Drayton Ct
- 7 Drayton Ct
- 1111 Test Listing Really Long Name St
- 1 Drayton Ct
- 417 Vivaldi Dr
- 413 Vivaldi Dr
- 9 Drayton Ct
- 409 Vivaldi Dr
- 405 Vivaldi Dr
- 419 Vivaldi Dr
- 5071 Roslyn Rd
- 0 Crievewood Dr
- 8 Drayton Ct
- 6 Drayton Ct
- 421 Vivaldi Dr
- 418 Vivaldi Dr
- 414 Vivaldi Dr
- 2 Biltmore Place
- 412 Vivaldi Dr
- 3 Amador Place