Estimated Value: $251,000 - $293,000
3
Beds
1
Bath
1,034
Sq Ft
$257/Sq Ft
Est. Value
About This Home
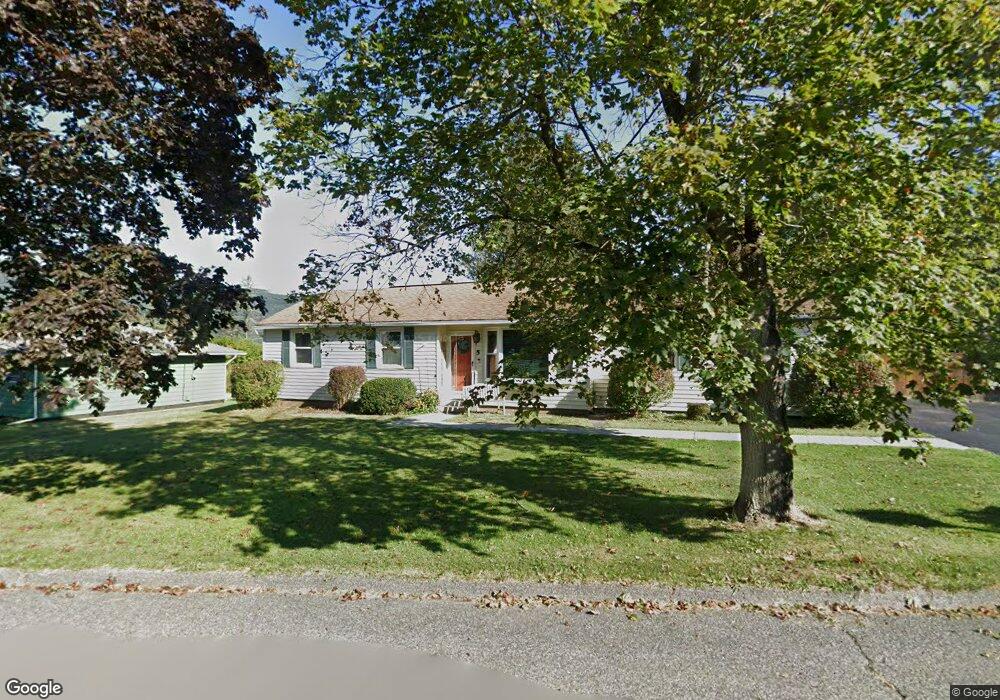
This home is located at 5 Dubis St, Adams, MA 01220 and is currently estimated at $265,654, approximately $256 per square foot. 5 Dubis St is a home located in Berkshire County with nearby schools including Hoosac Valley Middle & High School, Berkshire Arts & Technology Charter Public School, and St. Stanislaus Kostka School.
Ownership History
Date
Name
Owned For
Owner Type
Purchase Details
Closed on
Oct 5, 2022
Sold by
Michaud-Doerring Adelle E and Cuddihy Robert M
Bought by
Sommer Michael J and Sommer Helene L
Current Estimated Value
Home Financials for this Owner
Home Financials are based on the most recent Mortgage that was taken out on this home.
Original Mortgage
$135,000
Outstanding Balance
$128,760
Interest Rate
5.55%
Mortgage Type
Purchase Money Mortgage
Estimated Equity
$136,894
Purchase Details
Closed on
Apr 6, 2005
Sold by
Ostaski David J and Lyons-Ostaski Michelle A
Bought by
Doerring Fredrick L and Michaud-Doerring Adelle E
Home Financials for this Owner
Home Financials are based on the most recent Mortgage that was taken out on this home.
Original Mortgage
$84,000
Interest Rate
5.7%
Mortgage Type
Purchase Money Mortgage
Purchase Details
Closed on
Oct 17, 2000
Sold by
Banas Kenneth J and Fourier Beverly A
Bought by
Ostaski David J and Lyons Ostaski Michelle
Home Financials for this Owner
Home Financials are based on the most recent Mortgage that was taken out on this home.
Original Mortgage
$95,920
Interest Rate
7.89%
Mortgage Type
Purchase Money Mortgage
Create a Home Valuation Report for This Property
The Home Valuation Report is an in-depth analysis detailing your home's value as well as a comparison with similar homes in the area
Home Values in the Area
Average Home Value in this Area
Purchase History
| Date | Buyer | Sale Price | Title Company |
|---|---|---|---|
| Sommer Michael J | $210,000 | None Available | |
| Doerring Fredrick L | $164,000 | -- | |
| Doerring Fredrick L | $164,000 | -- | |
| Ostaski David J | $119,900 | -- |
Source: Public Records
Mortgage History
| Date | Status | Borrower | Loan Amount |
|---|---|---|---|
| Open | Sommer Michael J | $135,000 | |
| Previous Owner | Ostaski David J | $74,000 | |
| Previous Owner | Ostaski David J | $25,000 | |
| Previous Owner | Doerring Fredrick L | $84,000 | |
| Previous Owner | Ostaski David J | $95,920 |
Source: Public Records
Tax History
| Year | Tax Paid | Tax Assessment Tax Assessment Total Assessment is a certain percentage of the fair market value that is determined by local assessors to be the total taxable value of land and additions on the property. | Land | Improvement |
|---|---|---|---|---|
| 2025 | $3,715 | $218,400 | $55,600 | $162,800 |
| 2024 | $3,506 | $199,900 | $52,300 | $147,600 |
| 2023 | $3,252 | $175,300 | $47,500 | $127,800 |
| 2022 | $3,165 | $151,500 | $41,300 | $110,200 |
| 2021 | $242 | $137,400 | $41,300 | $96,100 |
| 2020 | $3,004 | $137,300 | $41,900 | $95,400 |
| 2019 | $4,871 | $137,300 | $41,900 | $95,400 |
| 2018 | $3,012 | $135,600 | $41,900 | $93,700 |
| 2017 | $2,898 | $135,600 | $41,900 | $93,700 |
| 2016 | $2,665 | $124,600 | $41,900 | $82,700 |
| 2015 | $2,618 | $122,500 | $43,800 | $78,700 |
| 2014 | $2,444 | $122,500 | $43,800 | $78,700 |
Source: Public Records
Map
Nearby Homes
Your Personal Tour Guide
Ask me questions while you tour the home.