5 Duchess Ct Houston, TX 77024
Estimated Value: $2,788,000 - $3,182,000
4
Beds
6
Baths
5,756
Sq Ft
$511/Sq Ft
Est. Value
About This Home
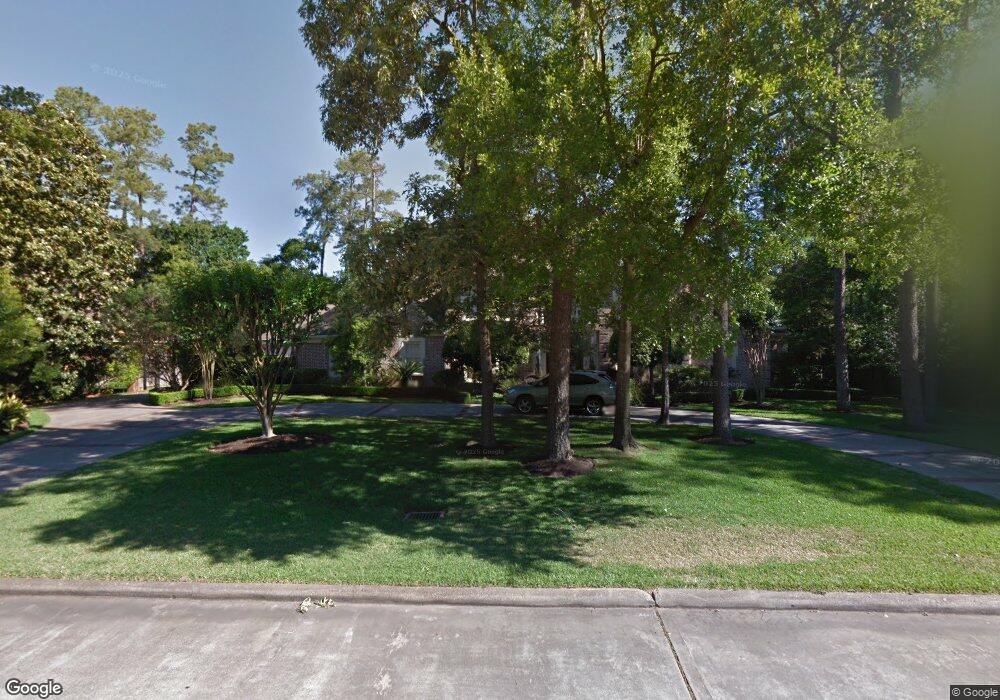
This home is located at 5 Duchess Ct, Houston, TX 77024 and is currently estimated at $2,939,368, approximately $510 per square foot. 5 Duchess Ct is a home located in Harris County with nearby schools including Bunker Hill Elementary School, Memorial Middle, and Memorial High School.
Ownership History
Date
Name
Owned For
Owner Type
Purchase Details
Closed on
Dec 28, 2004
Sold by
Coleman Brandon C and Coleman Cynthia A
Bought by
Halliday Scott K and Halliday Jeni E
Current Estimated Value
Home Financials for this Owner
Home Financials are based on the most recent Mortgage that was taken out on this home.
Original Mortgage
$1,000,000
Outstanding Balance
$475,261
Interest Rate
4.87%
Mortgage Type
Purchase Money Mortgage
Estimated Equity
$2,464,107
Purchase Details
Closed on
Aug 5, 1999
Sold by
Pollock Richard L and Pollock Deborah F
Bought by
Coleman Brandon C and Coleman Cynthia A
Home Financials for this Owner
Home Financials are based on the most recent Mortgage that was taken out on this home.
Original Mortgage
$975,000
Interest Rate
7.63%
Create a Home Valuation Report for This Property
The Home Valuation Report is an in-depth analysis detailing your home's value as well as a comparison with similar homes in the area
Home Values in the Area
Average Home Value in this Area
Purchase History
| Date | Buyer | Sale Price | Title Company |
|---|---|---|---|
| Halliday Scott K | -- | Startex Title Company | |
| Coleman Brandon C | -- | Charter Title Company |
Source: Public Records
Mortgage History
| Date | Status | Borrower | Loan Amount |
|---|---|---|---|
| Open | Halliday Scott K | $1,000,000 | |
| Previous Owner | Coleman Brandon C | $975,000 |
Source: Public Records
Tax History Compared to Growth
Tax History
| Year | Tax Paid | Tax Assessment Tax Assessment Total Assessment is a certain percentage of the fair market value that is determined by local assessors to be the total taxable value of land and additions on the property. | Land | Improvement |
|---|---|---|---|---|
| 2025 | $34,230 | $2,456,497 | $1,258,950 | $1,197,547 |
| 2024 | $34,230 | $2,315,725 | $1,216,985 | $1,098,740 |
| 2023 | $34,230 | $1,982,421 | $1,154,038 | $828,383 |
| 2022 | $9,693 | $2,313,166 | $1,154,038 | $1,159,128 |
| 2021 | $44,976 | $2,057,000 | $1,091,090 | $965,910 |
| 2020 | $45,670 | $2,062,170 | $1,091,090 | $971,080 |
| 2019 | $48,212 | $2,090,100 | $1,091,090 | $999,010 |
| 2018 | $10,536 | $2,073,500 | $1,091,090 | $982,410 |
| 2017 | $48,061 | $2,083,568 | $1,091,090 | $992,478 |
| 2016 | $45,385 | $2,083,568 | $1,091,090 | $992,478 |
| 2015 | $30,804 | $2,083,568 | $1,091,090 | $992,478 |
| 2014 | $30,804 | $1,821,000 | $944,213 | $876,787 |
Source: Public Records
Map
Nearby Homes
- 601 Strey Ln
- 11910 Heritage Ln
- 12003 Tall Oaks St
- 345 Knipp Rd
- 12222 Broken Bough Dr
- 711 Timber Hill Dr
- 11718 Broken Bough Cir
- 12 Gage Ct
- 12326 Old Oaks Dr
- 11933 Barryknoll Ln
- 11905 Barryknoll Ln
- 12334 Beauregard Dr
- 12231 Kimberley Ln
- 318 Knipp Rd
- 234 Plantation Rd
- 12406 Overcup Dr
- 827 Bunker Hill Rd
- 826 Bunker Hill Rd
- 11801 Barryknoll Ln
- 11729 Joan of Arc Dr
- 6 Heritage Ct
- 6 Duchess Ct
- 2 Duchess Ct
- 7 Heritage Ct
- 1 Duchess Ct
- 5 Heritage Ct
- 3 Duchess Ct
- 4 Duchess Ct
- 3 Rip Van Winkle Ln
- 2 Heritage Ct
- 1 Rip Van Winkle Ln
- 10 Beebe Ln
- 1 Heritage Ct
- 4 Heritage Ct
- 3 Heritage Ct
- 1 Lazee Trail
- 5 Rip Van Winkle Ln
- 11922 Knippwood Ln
- 11921 Knippwood Ln
- 11931 Homewood Ln