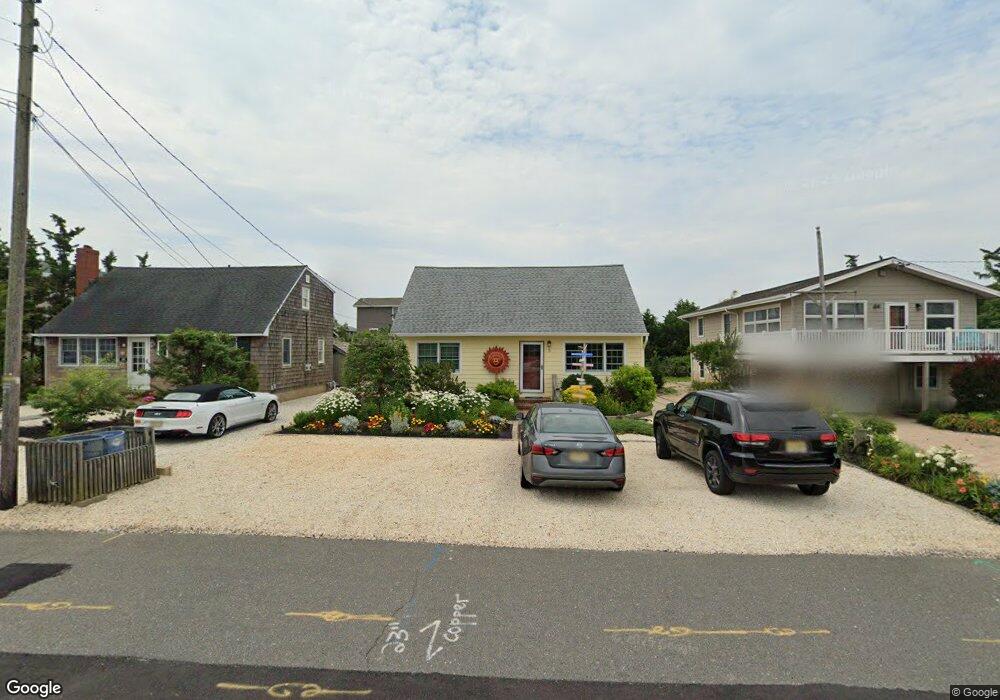
5 E 21st St Barnegat Light, NJ 08006
Long Beach Island NeighborhoodEstimated Value: $1,206,945 - $1,438,000
4
Beds
2
Baths
1,287
Sq Ft
$1,041/Sq Ft
Est. Value
About This Home
This home is located at 5 E 21st St, Barnegat Light, NJ 08006 and is currently estimated at $1,339,486, approximately $1,040 per square foot. 5 E 21st St is a home with nearby schools including Ethel A. Jacobsen Elementary School, Long Beach Island Grade School, and Southern Regional Middle School.
Ownership History
Date
Name
Owned For
Owner Type
Purchase Details
Closed on
Apr 23, 2018
Sold by
Slutzky Timothy and Slutzky Dennis
Bought by
Slutzky Dennis
Current Estimated Value
Home Financials for this Owner
Home Financials are based on the most recent Mortgage that was taken out on this home.
Original Mortgage
$375,000
Outstanding Balance
$267,328
Interest Rate
4.45%
Mortgage Type
New Conventional
Estimated Equity
$1,072,158
Purchase Details
Closed on
Dec 18, 2013
Sold by
Mescolotto Valentina and Slutzky Timothy
Bought by
Slutzky Timothy and Slutzky Dennis
Home Financials for this Owner
Home Financials are based on the most recent Mortgage that was taken out on this home.
Original Mortgage
$135,000
Interest Rate
3.12%
Mortgage Type
Adjustable Rate Mortgage/ARM
Purchase Details
Closed on
Dec 12, 2003
Sold by
Slutzky Gregory
Bought by
Mescolotto Valentina and Slutzky Dennis
Create a Home Valuation Report for This Property
The Home Valuation Report is an in-depth analysis detailing your home's value as well as a comparison with similar homes in the area
Home Values in the Area
Average Home Value in this Area
Purchase History
| Date | Buyer | Sale Price | Title Company |
|---|---|---|---|
| Slutzky Dennis | $375,000 | -- | |
| Slutzky Timothy | $215,333 | Westcor Land Title Ins Co | |
| Mescolotto Valentina | $150,000 | None Available |
Source: Public Records
Mortgage History
| Date | Status | Borrower | Loan Amount |
|---|---|---|---|
| Open | Slutzky Dennis | $375,000 | |
| Previous Owner | Slutzky Timothy | $135,000 |
Source: Public Records
Tax History
| Year | Tax Paid | Tax Assessment Tax Assessment Total Assessment is a certain percentage of the fair market value that is determined by local assessors to be the total taxable value of land and additions on the property. | Land | Improvement |
|---|---|---|---|---|
| 2025 | $6,267 | $621,700 | $475,000 | $146,700 |
| 2024 | $5,539 | $621,700 | $475,000 | $146,700 |
Source: Public Records
Map
Nearby Homes
Your Personal Tour Guide
Ask me questions while you tour the home.