5 E Oliver St Fulton, MO 65251
Estimated Value: $120,000 - $177,000
--
Bed
1
Bath
1,734
Sq Ft
$86/Sq Ft
Est. Value
About This Home
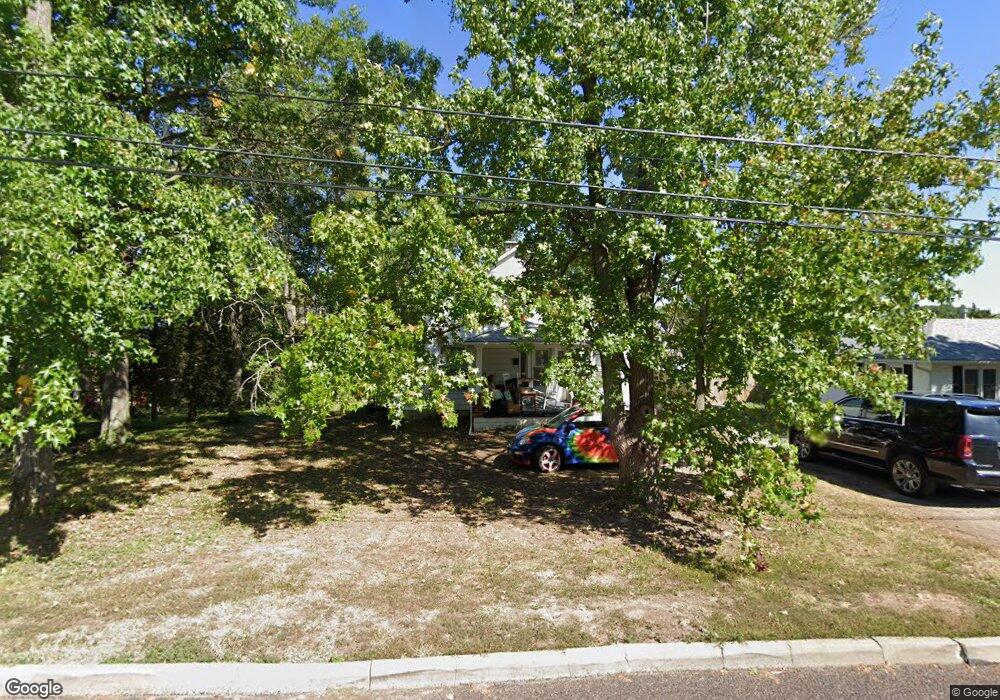
This home is located at 5 E Oliver St, Fulton, MO 65251 and is currently estimated at $149,903, approximately $86 per square foot. 5 E Oliver St is a home located in Callaway County with nearby schools including Fulton Senior High School, Kingdom Christian Academy, and St. Peter Catholic School.
Ownership History
Date
Name
Owned For
Owner Type
Purchase Details
Closed on
Feb 17, 2024
Sold by
Fifer Doug and Fifer Gretchen
Bought by
Keipp Elmer Fred and Keipp Kathryn Sue
Current Estimated Value
Home Financials for this Owner
Home Financials are based on the most recent Mortgage that was taken out on this home.
Original Mortgage
$159,913
Outstanding Balance
$157,082
Interest Rate
6.6%
Mortgage Type
Construction
Estimated Equity
-$7,179
Purchase Details
Closed on
Sep 26, 2023
Sold by
Fifer Doug
Bought by
Keipp Elmer Fred and Keipp Kathryn Sue
Purchase Details
Closed on
May 5, 2023
Sold by
Wade Kathryn J
Bought by
Fifer Doug and Fifer Gretchen
Create a Home Valuation Report for This Property
The Home Valuation Report is an in-depth analysis detailing your home's value as well as a comparison with similar homes in the area
Home Values in the Area
Average Home Value in this Area
Purchase History
| Date | Buyer | Sale Price | Title Company |
|---|---|---|---|
| Keipp Elmer Fred | -- | None Listed On Document | |
| Keipp Elmer Fred | -- | None Listed On Document | |
| Fifer Doug | -- | Monarch Title |
Source: Public Records
Mortgage History
| Date | Status | Borrower | Loan Amount |
|---|---|---|---|
| Open | Keipp Elmer Fred | $159,913 |
Source: Public Records
Tax History Compared to Growth
Tax History
| Year | Tax Paid | Tax Assessment Tax Assessment Total Assessment is a certain percentage of the fair market value that is determined by local assessors to be the total taxable value of land and additions on the property. | Land | Improvement |
|---|---|---|---|---|
| 2024 | $853 | $13,798 | $0 | $0 |
| 2023 | $853 | $11,701 | $0 | $0 |
| 2022 | $720 | $11,701 | $2,252 | $9,449 |
| 2021 | $719 | $11,701 | $2,252 | $9,449 |
| 2020 | $729 | $11,701 | $2,252 | $9,449 |
| 2019 | $706 | $11,701 | $2,252 | $9,449 |
| 2018 | $730 | $11,701 | $2,252 | $9,449 |
| 2017 | $649 | $11,701 | $2,252 | $9,449 |
| 2016 | $615 | $10,620 | $0 | $0 |
| 2015 | $601 | $10,620 | $0 | $0 |
| 2014 | -- | $11,420 | $0 | $0 |
Source: Public Records
Map
Nearby Homes
- 106 Schultze St
- 509 S Business 54
- 0 Callaway Dr
- 308 E 6th St
- 703 Bluff St
- 801 Court St
- TBD Route O
- 0
- 0 Greenwood Hills Lot#18
- 528 Kinleigh Dr
- 533 Kinleigh
- 3.69 ACRES Tennyson Rd
- 710 Hollyhock Dr
- 314 W 9th St
- 303 E 9th St
- 250 Tennyson Rd
- 1311 Cote Sans Dessein Rd
- 506 E 10th St
- 2946 Missouri F
- 1202 Bluff St