Estimated Value: $289,691 - $423,000
6
Beds
2
Baths
3,652
Sq Ft
$95/Sq Ft
Est. Value
About This Home
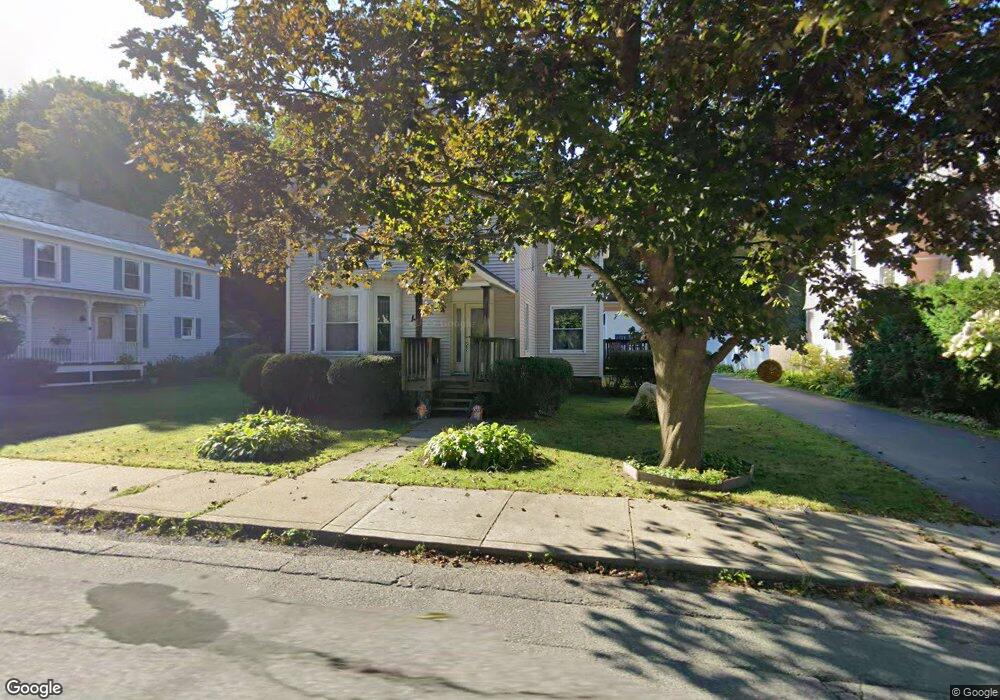
This home is located at 5 East St, Adams, MA 01220 and is currently estimated at $347,923, approximately $95 per square foot. 5 East St is a home located in Berkshire County with nearby schools including Hoosac Valley Middle & High School, Berkshire Arts & Technology Charter Public School, and St. Stanislaus Kostka School.
Ownership History
Date
Name
Owned For
Owner Type
Purchase Details
Closed on
Jul 3, 2002
Sold by
Romaniak Carol A
Bought by
Morgan Willard W
Current Estimated Value
Home Financials for this Owner
Home Financials are based on the most recent Mortgage that was taken out on this home.
Original Mortgage
$132,500
Outstanding Balance
$56,607
Interest Rate
6.82%
Mortgage Type
Purchase Money Mortgage
Estimated Equity
$291,316
Create a Home Valuation Report for This Property
The Home Valuation Report is an in-depth analysis detailing your home's value as well as a comparison with similar homes in the area
Home Values in the Area
Average Home Value in this Area
Purchase History
| Date | Buyer | Sale Price | Title Company |
|---|---|---|---|
| Morgan Willard W | $145,000 | -- |
Source: Public Records
Mortgage History
| Date | Status | Borrower | Loan Amount |
|---|---|---|---|
| Open | Morgan Willard W | $50,000 | |
| Open | Morgan Willard W | $132,500 | |
| Previous Owner | Morgan Willard W | $25,000 | |
| Previous Owner | Morgan Willard W | $20,000 |
Source: Public Records
Tax History Compared to Growth
Tax History
| Year | Tax Paid | Tax Assessment Tax Assessment Total Assessment is a certain percentage of the fair market value that is determined by local assessors to be the total taxable value of land and additions on the property. | Land | Improvement |
|---|---|---|---|---|
| 2025 | $4,378 | $257,400 | $60,100 | $197,300 |
| 2024 | $4,132 | $235,600 | $56,500 | $179,100 |
| 2023 | $3,862 | $208,200 | $51,400 | $156,800 |
| 2022 | $3,775 | $180,700 | $44,700 | $136,000 |
| 2021 | $3,698 | $163,500 | $44,700 | $118,800 |
| 2020 | $3,584 | $163,800 | $44,800 | $119,000 |
| 2019 | $3,504 | $163,800 | $44,800 | $119,000 |
| 2018 | $3,589 | $161,600 | $44,800 | $116,800 |
| 2017 | $3,983 | $186,400 | $44,800 | $141,600 |
| 2016 | $3,012 | $140,800 | $44,800 | $96,000 |
| 2015 | $2,951 | $138,100 | $46,800 | $91,300 |
| 2014 | $2,755 | $138,100 | $46,800 | $91,300 |
Source: Public Records
Map
Nearby Homes