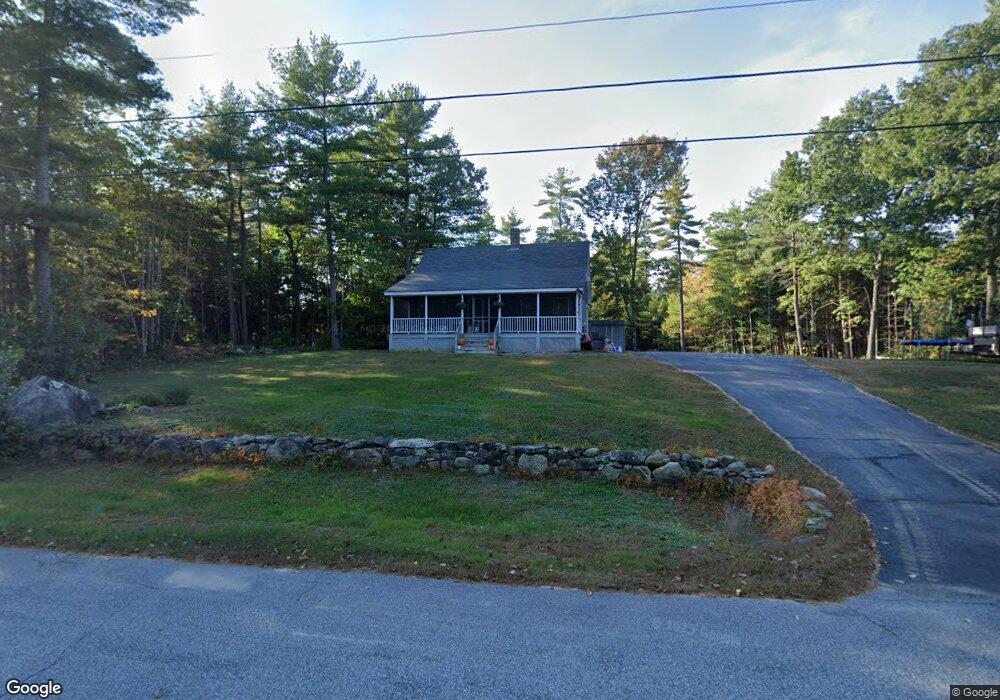
5 Easy St Standish, ME 04084
Richville NeighborhoodEstimated Value: $429,000 - $463,000
4
Beds
2
Baths
1,344
Sq Ft
$327/Sq Ft
Est. Value
About This Home
This home is located at 5 Easy St, Standish, ME 04084 and is currently estimated at $438,880, approximately $326 per square foot. 5 Easy St is a home located in Cumberland County with nearby schools including Bonny Eagle High School.
Ownership History
Date
Name
Owned For
Owner Type
Purchase Details
Closed on
Sep 17, 2019
Sold by
Kenney Ronda D and Kenney Joseph M
Bought by
Kenney Ronda D
Current Estimated Value
Home Financials for this Owner
Home Financials are based on the most recent Mortgage that was taken out on this home.
Original Mortgage
$113,960
Outstanding Balance
$100,938
Interest Rate
4.37%
Mortgage Type
FHA
Estimated Equity
$337,942
Create a Home Valuation Report for This Property
The Home Valuation Report is an in-depth analysis detailing your home's value as well as a comparison with similar homes in the area
Home Values in the Area
Average Home Value in this Area
Purchase History
| Date | Buyer | Sale Price | Title Company |
|---|---|---|---|
| Kenney Ronda D | -- | -- | |
| Kenney Ronda D | -- | -- |
Source: Public Records
Mortgage History
| Date | Status | Borrower | Loan Amount |
|---|---|---|---|
| Open | Kenney Ronda D | $113,960 | |
| Closed | Kenney Ronda D | $113,960 |
Source: Public Records
Tax History
| Year | Tax Paid | Tax Assessment Tax Assessment Total Assessment is a certain percentage of the fair market value that is determined by local assessors to be the total taxable value of land and additions on the property. | Land | Improvement |
|---|---|---|---|---|
| 2024 | $3,722 | $295,400 | $83,300 | $212,100 |
| 2023 | $3,444 | $248,700 | $59,400 | $189,300 |
| 2022 | $2,959 | $204,800 | $53,300 | $151,500 |
| 2021 | $2,901 | $193,400 | $49,000 | $144,400 |
| 2019 | $2,676 | $187,100 | $46,800 | $140,300 |
| 2018 | $2,338 | $182,800 | $42,500 | $140,300 |
| 2017 | $2,422 | $182,800 | $42,500 | $140,300 |
| 2016 | $2,343 | $182,800 | $42,500 | $140,300 |
| 2015 | $2,338 | $182,800 | $42,500 | $140,300 |
| 2013 | -- | $190,700 | $50,400 | $140,300 |
Source: Public Records
Map
Nearby Homes
Your Personal Tour Guide
Ask me questions while you tour the home.