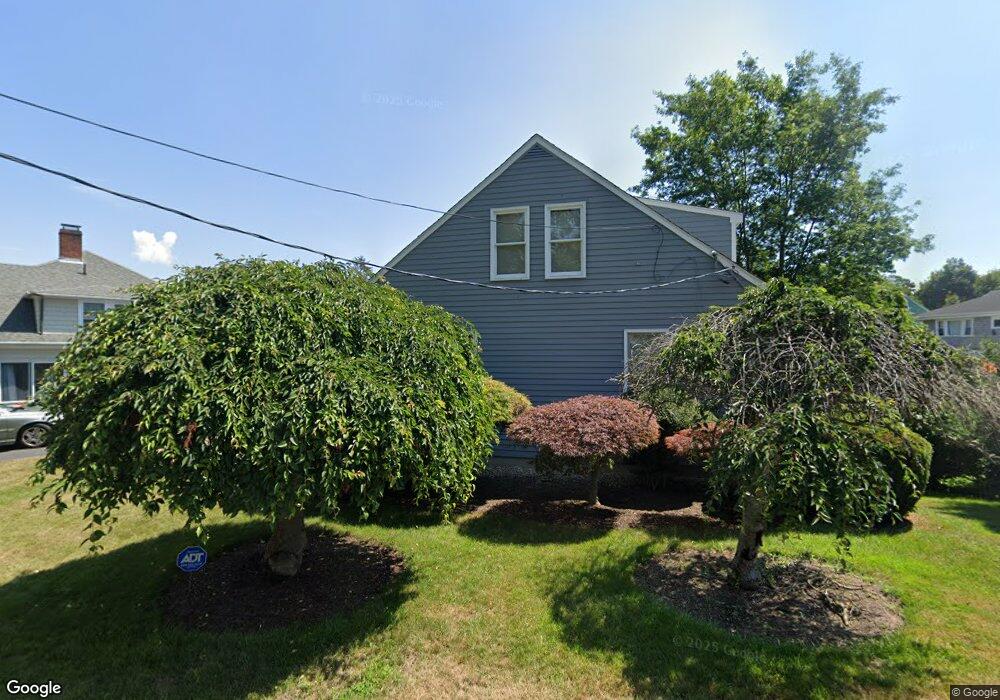
5 Edgemere Rd Marblehead, MA 01945
Estimated Value: $1,168,112 - $1,646,000
3
Beds
3
Baths
2,468
Sq Ft
$536/Sq Ft
Est. Value
About This Home
This home is located at 5 Edgemere Rd, Marblehead, MA 01945 and is currently estimated at $1,323,028, approximately $536 per square foot. 5 Edgemere Rd is a home located in Essex County with nearby schools including Marblehead High School, Marblehead Community Charter Public School, and Tower School.
Ownership History
Date
Name
Owned For
Owner Type
Purchase Details
Closed on
Jul 12, 2000
Sold by
Rodgers James E and Coffin Nancy C
Bought by
Mervis Paul B and Mervis Laurel
Current Estimated Value
Home Financials for this Owner
Home Financials are based on the most recent Mortgage that was taken out on this home.
Original Mortgage
$380,000
Interest Rate
8.5%
Mortgage Type
Purchase Money Mortgage
Create a Home Valuation Report for This Property
The Home Valuation Report is an in-depth analysis detailing your home's value as well as a comparison with similar homes in the area
Home Values in the Area
Average Home Value in this Area
Purchase History
| Date | Buyer | Sale Price | Title Company |
|---|---|---|---|
| Mervis Paul B | $480,000 | -- | |
| Mervis Paul B | $480,000 | -- |
Source: Public Records
Mortgage History
| Date | Status | Borrower | Loan Amount |
|---|---|---|---|
| Open | Mervis Paul B | $333,700 | |
| Closed | Mervis Paul B | $380,000 |
Source: Public Records
Tax History
| Year | Tax Paid | Tax Assessment Tax Assessment Total Assessment is a certain percentage of the fair market value that is determined by local assessors to be the total taxable value of land and additions on the property. | Land | Improvement |
|---|---|---|---|---|
| 2025 | $8,956 | $989,600 | $638,300 | $351,300 |
| 2024 | $8,930 | $996,600 | $765,700 | $230,900 |
| 2023 | $7,587 | $758,700 | $506,900 | $251,800 |
| 2022 | $7,893 | $750,300 | $500,700 | $249,600 |
| 2021 | $7,296 | $700,200 | $450,600 | $249,600 |
| 2020 | $6,957 | $669,600 | $450,600 | $219,000 |
| 2019 | $6,899 | $642,400 | $425,600 | $216,800 |
| 2018 | $6,803 | $617,300 | $400,500 | $216,800 |
| 2017 | $6,384 | $579,800 | $363,000 | $216,800 |
| 2016 | $6,297 | $567,300 | $350,500 | $216,800 |
| 2015 | $5,804 | $523,800 | $325,400 | $198,400 |
| 2014 | $5,484 | $494,500 | $300,400 | $194,100 |
Source: Public Records
Map
Nearby Homes
- 89 Naugus Ave
- 4 Broadmere Way
- 2 Beacon Hill Rd
- 55 Pitman Rd
- 1 Knollwood Rd
- 3 Frost Ln Unit 1
- 5 Winter Island Rd
- 75 Pond St
- 20 Mechanic Square Unit 3
- 20 Mechanic Square Unit 2
- 132 Elm St
- 132 Elm St Unit 132
- 7 Mechanic Ct
- 23 Beach Ave Unit 1
- 45 Pleasant St
- 66 Pleasant St Unit 1
- 66 Pleasant St Unit 2
- 4 Beach Ave
- 102 Front St Unit 1
- 100 Village St