5 Edson St Nashua, NH 03064
North End Nashua NeighborhoodEstimated Value: $539,000 - $652,000
About This Home
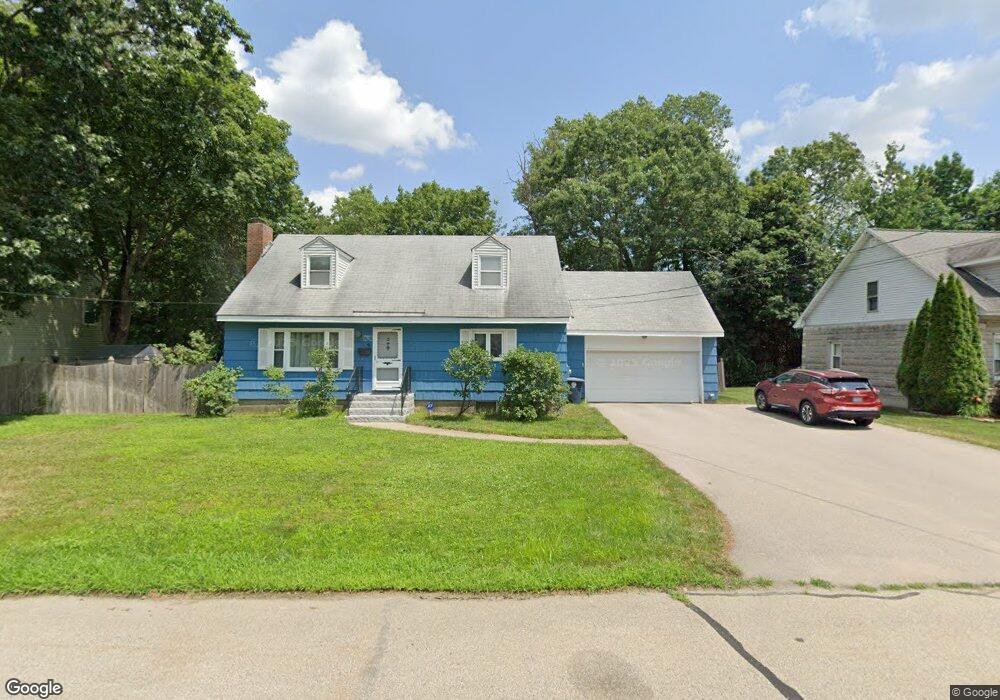
This home is located at 5 Edson St, Nashua, NH 03064 and is currently estimated at $583,436, approximately $313 per square foot. 5 Edson St is a home located in Hillsborough County with nearby schools including Mount Pleasant Elementary School, Pennichuck Middle School, and Nashua High School North.
Ownership History
We collect this data history from publicly available records. To have your information removed, we recommend requesting removal directly through your county’s website.
Purchase Details
Home Values in the Area
Average Home Value in this Area
Purchase History
We collect this data history from publicly available records. To have your information removed, we recommend requesting removal directly through your county’s website.
| Date | Buyer | Sale Price | Title Company |
|---|---|---|---|
| $135,000 | -- |
Mortgage History
We collect this data history from publicly available records. To have your information removed, we recommend requesting removal directly through your county’s website.
| Date | Status | Borrower | Loan Amount |
|---|---|---|---|
| Open | $161,600 | ||
| Closed | $60,000 | ||
| Closed | $52,000 |
Tax History
We collect this data history from publicly available records. To have your information removed, we recommend requesting removal directly through your county’s website.
| Year | Tax Paid | Tax Assessment Tax Assessment Total Assessment is a certain percentage of the fair market value that is determined by local assessors to be the total taxable value of land and additions on the property. | Land | Improvement |
|---|---|---|---|---|
| 2025 | $8,848 | $525,700 | $160,400 | $365,300 |
| 2024 | $8,359 | $525,700 | $160,400 | $365,300 |
| 2023 | $7,881 | $432,300 | $128,300 | $304,000 |
| 2022 | $7,812 | $432,300 | $128,300 | $304,000 |
| 2021 | $6,769 | $291,500 | $98,800 | $192,700 |
| 2020 | $6,489 | $287,000 | $98,800 | $188,200 |
| 2019 | $6,696 | $307,700 | $98,800 | $208,900 |
| 2018 | $6,526 | $307,700 | $98,800 | $208,900 |
| 2017 | $5,896 | $228,600 | $85,200 | $143,400 |
| 2016 | $5,731 | $228,600 | $85,200 | $143,400 |
| 2015 | $5,608 | $228,600 | $85,200 | $143,400 |
| 2014 | $5,498 | $228,600 | $85,200 | $143,400 |
Map
- 8 Burnham Ave
- 37 Chester St
- 53 Atherton Ave
- 151 Tolles St Unit 244
- 71 Concord St
- 70 Walden Pond Dr
- 70 Concord St
- 15 Atherton Ave
- 36 Courtland St Unit 38
- 32 Norton St
- 27 Courtland St
- 13 Sapphire Ln
- 4 Gambia St
- 24 Hall Ave
- 2 Taunton Ln
- 18 Manchester St
- 19 Cross St
- 525 Abbott Farm Ln
- 111 Concord St
- 19 Orange St
Ask me questions while you tour the home.