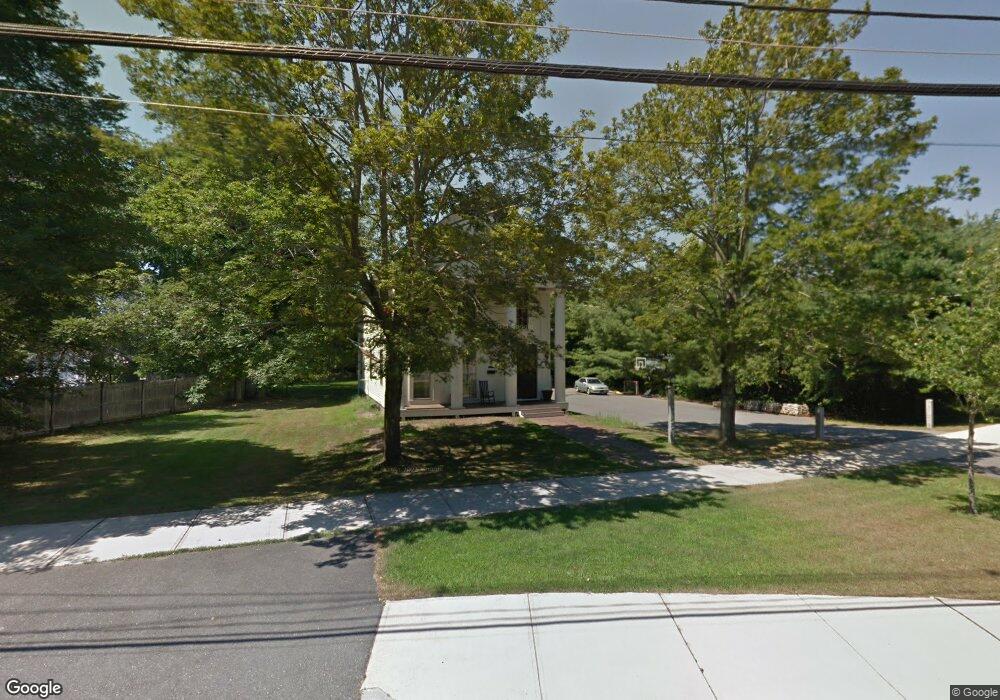
5 Elm St Georgetown, MA 01833
Estimated Value: $791,736 - $861,000
3
Beds
2
Baths
2,480
Sq Ft
$330/Sq Ft
Est. Value
About This Home
This home is located at 5 Elm St, Georgetown, MA 01833 and is currently estimated at $817,684, approximately $329 per square foot. 5 Elm St is a home located in Essex County with nearby schools including Perley Elementary School, Penn Brook School, and Georgetown High School.
Ownership History
Date
Name
Owned For
Owner Type
Purchase Details
Closed on
Oct 15, 2019
Sold by
Maglio Deanna R and Maglio Dorothy A
Bought by
Maglio Deanna R and Maglio John J
Current Estimated Value
Home Financials for this Owner
Home Financials are based on the most recent Mortgage that was taken out on this home.
Original Mortgage
$276,000
Outstanding Balance
$240,673
Interest Rate
3.7%
Mortgage Type
New Conventional
Estimated Equity
$577,011
Purchase Details
Closed on
Jan 22, 2016
Sold by
Maglio Dorothy A
Bought by
Maglio Dorothy A and Maglio John J
Purchase Details
Closed on
Feb 6, 2014
Sold by
Macalone Kathy L
Bought by
Maglio Joseph S and Maglio Dorothy A
Purchase Details
Closed on
Dec 30, 2011
Sold by
Med Rt and Wages
Bought by
Delorenzo Kathy L
Purchase Details
Closed on
Nov 7, 1996
Sold by
Spaulding Colonial Rep
Bought by
Med Rt and Delorenzo
Create a Home Valuation Report for This Property
The Home Valuation Report is an in-depth analysis detailing your home's value as well as a comparison with similar homes in the area
Home Values in the Area
Average Home Value in this Area
Purchase History
| Date | Buyer | Sale Price | Title Company |
|---|---|---|---|
| Maglio Deanna R | -- | -- | |
| Maglio Dorothy A | -- | -- | |
| Maglio Joseph S | $193,500 | -- | |
| Maglio Joseph S | $193,500 | -- | |
| Delorenzo Kathy L | -- | -- | |
| Med Rt | $170,000 | -- |
Source: Public Records
Mortgage History
| Date | Status | Borrower | Loan Amount |
|---|---|---|---|
| Open | Maglio Deanna R | $276,000 | |
| Previous Owner | Med Rt | $30,000 |
Source: Public Records
Tax History
| Year | Tax Paid | Tax Assessment Tax Assessment Total Assessment is a certain percentage of the fair market value that is determined by local assessors to be the total taxable value of land and additions on the property. | Land | Improvement |
|---|---|---|---|---|
| 2025 | $7,983 | $721,800 | $279,600 | $442,200 |
| 2024 | $6,975 | $555,800 | $192,800 | $363,000 |
| 2023 | $7,082 | $545,600 | $192,800 | $352,800 |
| 2022 | $7,070 | $502,100 | $167,600 | $334,500 |
| 2021 | $6,402 | $402,900 | $167,600 | $235,300 |
| 2020 | $6,414 | $402,900 | $167,600 | $235,300 |
| 2019 | $5,160 | $327,000 | $164,400 | $162,600 |
| 2018 | $5,193 | $327,000 | $164,400 | $162,600 |
| 2017 | $5,195 | $320,500 | $164,400 | $156,100 |
| 2016 | $4,772 | $300,700 | $164,400 | $136,300 |
| 2015 | $4,604 | $287,200 | $193,300 | $93,900 |
| 2014 | $4,035 | $287,200 | $193,300 | $93,900 |
Source: Public Records
Map
Nearby Homes
- 11 Central St
- 32 Summer St
- 8 Molloy Rd
- 206 W Main St Unit 5
- 206 W Main St Unit 4
- 206 W Main St Unit 2
- 206 W Main St Unit 3
- 231 W Main St
- 107 King George Dr Unit 9
- 53 Woodcrest Rd
- 98 West St
- 870 Haverhill St Unit 2B
- 10 Ashcroft Cir
- 534 Ipswich Rd
- 24 Appleton Ln
- 66 Parish Rd Unit 8
- 11 Main St
- 1 Atwood Ln
- 13 Main St
- Lot B Willow Ave
Your Personal Tour Guide
Ask me questions while you tour the home.