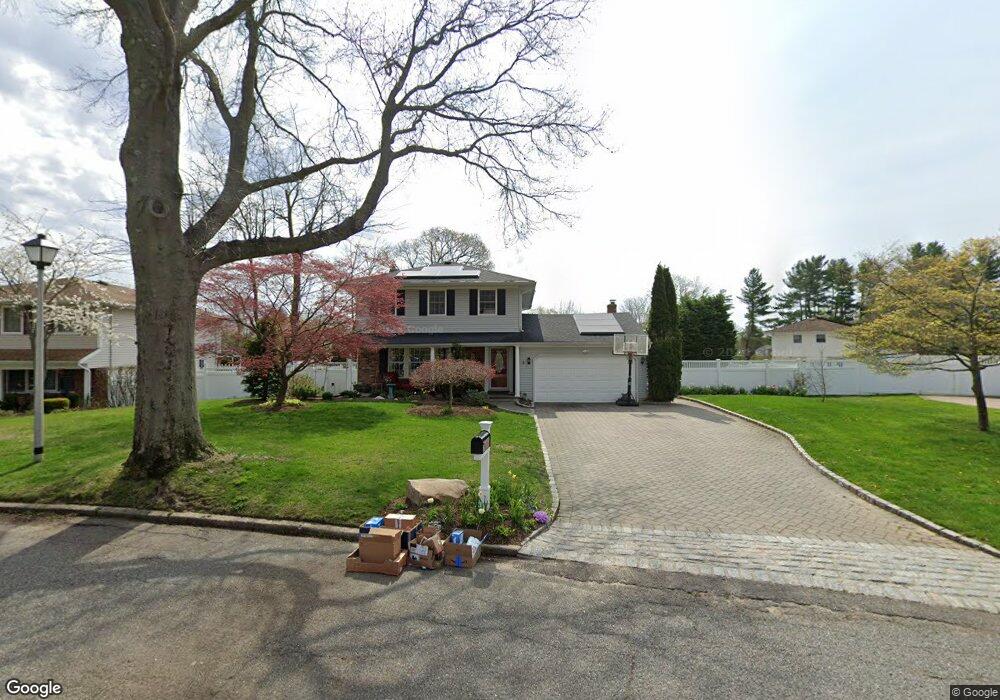
5 Empire Ct ComMacK, NY 11725
Estimated Value: $883,814 - $1,241,000
4
Beds
3
Baths
2,367
Sq Ft
$429/Sq Ft
Est. Value
About This Home
This home is located at 5 Empire Ct, ComMacK, NY 11725 and is currently estimated at $1,015,454, approximately $429 per square foot. 5 Empire Ct is a home located in Suffolk County with nearby schools including Commack Middle School and Commack High School.
Ownership History
Date
Name
Owned For
Owner Type
Purchase Details
Closed on
Oct 21, 2020
Sold by
Schwazbrott Sheldon and Schwazbrott Diane
Bought by
Nash Marc and Nash Shayna
Current Estimated Value
Home Financials for this Owner
Home Financials are based on the most recent Mortgage that was taken out on this home.
Original Mortgage
$560,800
Outstanding Balance
$497,892
Interest Rate
2.8%
Mortgage Type
New Conventional
Estimated Equity
$517,562
Purchase Details
Closed on
Sep 12, 2007
Sold by
Pirraglia James
Bought by
Oldham Robert
Purchase Details
Closed on
Jul 11, 2000
Sold by
Grant Miriam A
Bought by
Pirraglia James and Pirraglia Ros Anne
Home Financials for this Owner
Home Financials are based on the most recent Mortgage that was taken out on this home.
Original Mortgage
$125,000
Interest Rate
8.06%
Create a Home Valuation Report for This Property
The Home Valuation Report is an in-depth analysis detailing your home's value as well as a comparison with similar homes in the area
Home Values in the Area
Average Home Value in this Area
Purchase History
| Date | Buyer | Sale Price | Title Company |
|---|---|---|---|
| Nash Marc | $701,000 | None Available | |
| Oldham Robert | $720,000 | Lawrence Rader | |
| Oldham Robert | $720,000 | Lawrence Rader | |
| Pirraglia James | $270,000 | First American Title Ins Co | |
| Pirraglia James | $270,000 | First American Title Ins Co |
Source: Public Records
Mortgage History
| Date | Status | Borrower | Loan Amount |
|---|---|---|---|
| Open | Nash Marc | $560,800 | |
| Previous Owner | Pirraglia James | $125,000 |
Source: Public Records
Tax History
| Year | Tax Paid | Tax Assessment Tax Assessment Total Assessment is a certain percentage of the fair market value that is determined by local assessors to be the total taxable value of land and additions on the property. | Land | Improvement |
|---|---|---|---|---|
| 2024 | $17,010 | $6,505 | $350 | $6,155 |
| 2023 | $17,010 | $6,205 | $350 | $5,855 |
| 2022 | $13,729 | $6,205 | $350 | $5,855 |
| 2021 | $13,729 | $6,205 | $350 | $5,855 |
| 2020 | $16,342 | $6,205 | $350 | $5,855 |
| 2019 | $16,342 | $6,205 | $350 | $5,855 |
| 2018 | -- | $6,205 | $350 | $5,855 |
| 2017 | $14,019 | $6,205 | $350 | $5,855 |
| 2016 | $13,882 | $6,205 | $350 | $5,855 |
| 2015 | -- | $6,205 | $350 | $5,855 |
| 2014 | -- | $6,205 | $350 | $5,855 |
Source: Public Records
Map
Nearby Homes
- 18 Melrose Ln
- 31 Marshmallow Dr
- 6 Hillview Ct
- 2 Max Way
- 40 Scholar Ln
- 4 Long Meadow Rd
- 68 Elder Dr
- 46 Harvest Ln
- 230 Townline Rd
- 9 Hayrick Ln
- 223 Town Line Rd
- 8 Whitebirch Ln
- 4 Whitebirch Ln
- 348 Town Line Rd
- 83 Manitou Trail
- 24 Kings Park Rd
- 96 Manitou Trail Unit 88
- 80 Washington Blvd
- 26 Whitebirch Ln
- 5 Plum Tree Ln
Your Personal Tour Guide
Ask me questions while you tour the home.