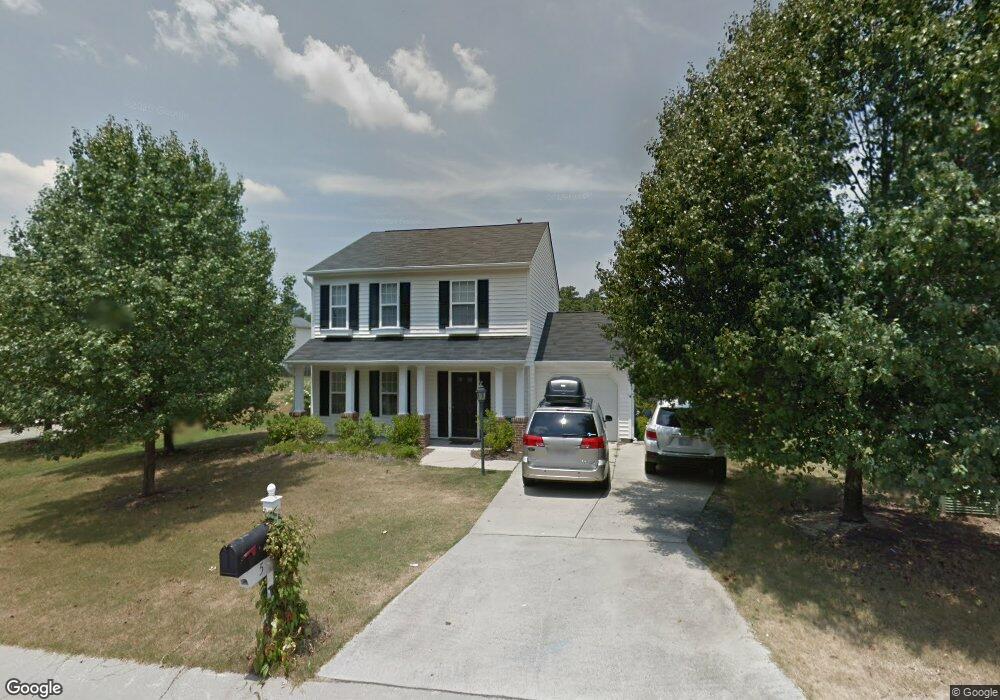
5 Epping Ct Durham, NC 27703
Eastern Durham NeighborhoodEstimated Value: $340,492 - $374,000
3
Beds
3
Baths
1,543
Sq Ft
$233/Sq Ft
Est. Value
About This Home
This home is located at 5 Epping Ct, Durham, NC 27703 and is currently estimated at $360,123, approximately $233 per square foot. 5 Epping Ct is a home located in Durham County with nearby schools including Oak Grove Elementary, John W Neal Middle School, and Southern School of Energy & Sustainability.
Ownership History
Date
Name
Owned For
Owner Type
Purchase Details
Closed on
Aug 3, 2023
Sold by
Porth Lane Daniel and Porth Cassandra Gene
Bought by
Porth Family Living Trust and Porth
Current Estimated Value
Purchase Details
Closed on
Apr 20, 2020
Sold by
Sarro Dina
Bought by
Porth Lane Daniel and Porth Cassandra Gene
Home Financials for this Owner
Home Financials are based on the most recent Mortgage that was taken out on this home.
Original Mortgage
$190,400
Interest Rate
3.3%
Mortgage Type
New Conventional
Purchase Details
Closed on
Sep 10, 2013
Sold by
Posey John D and Posey Sally M
Bought by
Sarro Dina
Home Financials for this Owner
Home Financials are based on the most recent Mortgage that was taken out on this home.
Original Mortgage
$149,150
Interest Rate
4.37%
Mortgage Type
New Conventional
Purchase Details
Closed on
Jul 18, 2002
Sold by
D R Horton Inc Torrey
Bought by
Posey John D and Posey Sally M
Home Financials for this Owner
Home Financials are based on the most recent Mortgage that was taken out on this home.
Original Mortgage
$134,204
Interest Rate
6.67%
Mortgage Type
FHA
Create a Home Valuation Report for This Property
The Home Valuation Report is an in-depth analysis detailing your home's value as well as a comparison with similar homes in the area
Home Values in the Area
Average Home Value in this Area
Purchase History
| Date | Buyer | Sale Price | Title Company |
|---|---|---|---|
| Porth Family Living Trust | -- | None Listed On Document | |
| Porth Lane Daniel | $238,000 | None Available | |
| Sarro Dina | $157,000 | None Available | |
| Posey John D | $136,500 | -- |
Source: Public Records
Mortgage History
| Date | Status | Borrower | Loan Amount |
|---|---|---|---|
| Previous Owner | Porth Lane Daniel | $190,400 | |
| Previous Owner | Sarro Dina | $149,150 | |
| Previous Owner | Posey John D | $134,204 |
Source: Public Records
Tax History
| Year | Tax Paid | Tax Assessment Tax Assessment Total Assessment is a certain percentage of the fair market value that is determined by local assessors to be the total taxable value of land and additions on the property. | Land | Improvement |
|---|---|---|---|---|
| 2025 | $3,289 | $331,765 | $90,750 | $241,015 |
| 2024 | $2,533 | $181,569 | $45,337 | $136,232 |
| 2023 | $2,378 | $181,569 | $45,337 | $136,232 |
| 2022 | $2,324 | $181,569 | $45,337 | $136,232 |
| 2021 | $2,313 | $181,569 | $45,337 | $136,232 |
| 2020 | $2,259 | $181,569 | $45,337 | $136,232 |
| 2019 | $2,259 | $181,569 | $45,337 | $136,232 |
| 2018 | $2,025 | $149,297 | $33,137 | $116,160 |
| 2017 | $2,010 | $149,297 | $33,137 | $116,160 |
| 2016 | $1,943 | $149,297 | $33,137 | $116,160 |
| 2015 | $2,074 | $149,822 | $31,130 | $118,692 |
| 2014 | $2,074 | $149,822 | $31,130 | $118,692 |
Source: Public Records
Map
Nearby Homes
- 107 Crosswood Dr
- 110 Kindlewood Dr
- 4505 Tyne Dr
- 208 Lick Creek Ln
- 4 Jarvis Ct
- 5706 Wrenwood Ct Unit Lt 116
- 2800-2809 Napoli Dr
- 4317 Marbrey Dr
- 210 Stallings Rd
- 5002 Wake Forest Hwy
- 502 Quartz Dr
- 442 Gus Rd
- 601 Crossing Dr
- 715 Patterson Rd
- 521 Quartz Dr
- 411 Bellmeade Bay Dr
- 501 Bellmeade Bay Dr
- 2 Tarrywood Ct
- 7 Duxford Ct
- 914 Flanders Dr
- 3 Epping Ct
- 7 Epping Ct
- 9 Epping Ct
- 304 Lanier Valley Dr
- 8 Epping Ct
- 204 Bermuda Green Dr
- 1 Epping Ct
- 6 Epping Ct
- 306 Lanier Valley Dr
- 10 Epping Ct
- 4 Epping Ct
- 206 Bermuda Green Dr
- 308 Lanier Valley Dr
- 12 Epping Ct
- 11 Epping Ct
- BQ179 Bermuda Green Dr
- 2 Epping Ct
- 108 Bermuda Green Dr
- 14 Epping Ct
- 310 Lanier Valley Dr
Your Personal Tour Guide
Ask me questions while you tour the home.