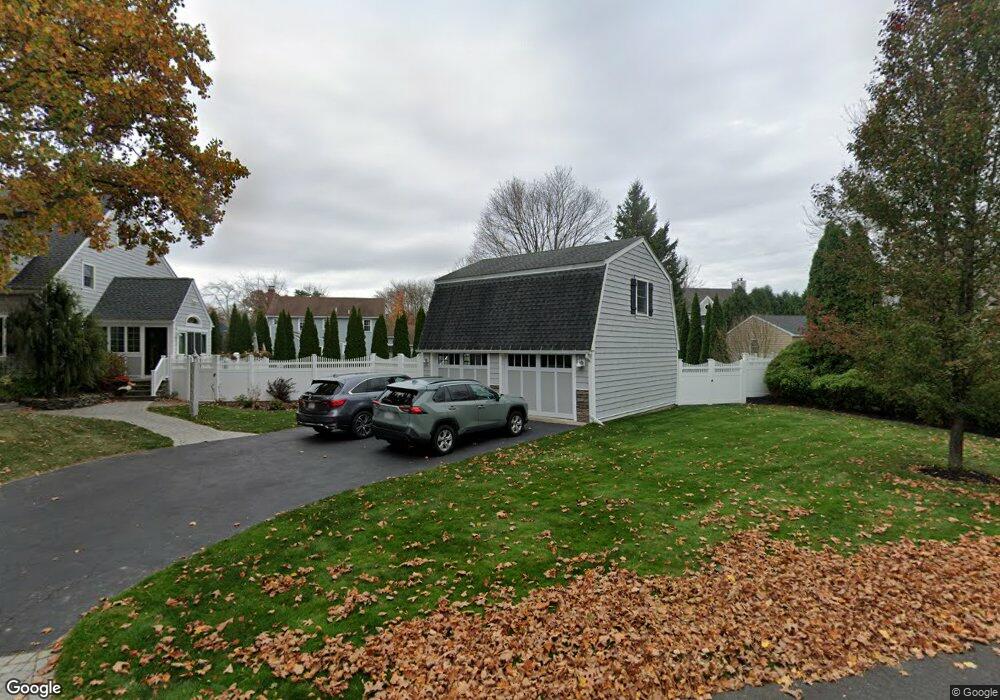
5 Finnegan Way Newburyport, MA 01950
Estimated Value: $1,221,000 - $1,338,000
5
Beds
3
Baths
2,424
Sq Ft
$528/Sq Ft
Est. Value
About This Home
This home is located at 5 Finnegan Way, Newburyport, MA 01950 and is currently estimated at $1,280,198, approximately $528 per square foot. 5 Finnegan Way is a home located in Essex County with nearby schools including Francis T. Bresnahan Elementary School, Edward G. Molin Elementary School, and Rupert A. Nock Middle School.
Ownership History
Date
Name
Owned For
Owner Type
Purchase Details
Closed on
Jan 12, 2012
Sold by
Schulz Samantha R
Bought by
Schulz Samantha R and Komorous Brian
Current Estimated Value
Home Financials for this Owner
Home Financials are based on the most recent Mortgage that was taken out on this home.
Original Mortgage
$382,250
Interest Rate
4%
Mortgage Type
New Conventional
Purchase Details
Closed on
Jul 20, 2010
Sold by
Humphrey 3Rd Richard S
Bought by
Schulz Samantha R
Purchase Details
Closed on
Sep 21, 2006
Sold by
Allman Andrew A and Cuthbert-Allman Catherine
Bought by
Humphrey Ricahrd
Purchase Details
Closed on
Aug 28, 1992
Sold by
Belanger Algar J and Belanger Dorothy
Bought by
Allman Andrew A and Allman Catherine
Create a Home Valuation Report for This Property
The Home Valuation Report is an in-depth analysis detailing your home's value as well as a comparison with similar homes in the area
Home Values in the Area
Average Home Value in this Area
Purchase History
| Date | Buyer | Sale Price | Title Company |
|---|---|---|---|
| Schulz Samantha R | -- | -- | |
| Schulz Samantha R | $418,001 | -- | |
| Humphrey Ricahrd | $590,000 | -- | |
| Allman Andrew A | $165,000 | -- |
Source: Public Records
Mortgage History
| Date | Status | Borrower | Loan Amount |
|---|---|---|---|
| Open | Allman Andrew A | $380,000 | |
| Closed | Allman Andrew A | $382,250 |
Source: Public Records
Tax History Compared to Growth
Tax History
| Year | Tax Paid | Tax Assessment Tax Assessment Total Assessment is a certain percentage of the fair market value that is determined by local assessors to be the total taxable value of land and additions on the property. | Land | Improvement |
|---|---|---|---|---|
| 2025 | $10,910 | $1,138,800 | $467,600 | $671,200 |
| 2024 | $10,455 | $1,048,600 | $425,000 | $623,600 |
| 2023 | $10,044 | $935,200 | $369,600 | $565,600 |
| 2022 | $9,274 | $772,200 | $308,000 | $464,200 |
| 2021 | $9,302 | $735,900 | $280,000 | $455,900 |
| 2020 | $9,109 | $709,400 | $280,000 | $429,400 |
| 2019 | $8,892 | $679,800 | $280,000 | $399,800 |
| 2018 | $8,696 | $655,800 | $266,700 | $389,100 |
| 2017 | $8,408 | $625,100 | $254,100 | $371,000 |
| 2016 | $8,118 | $606,300 | $231,400 | $374,900 |
| 2015 | $7,145 | $535,600 | $231,400 | $304,200 |
Source: Public Records
Map
Nearby Homes