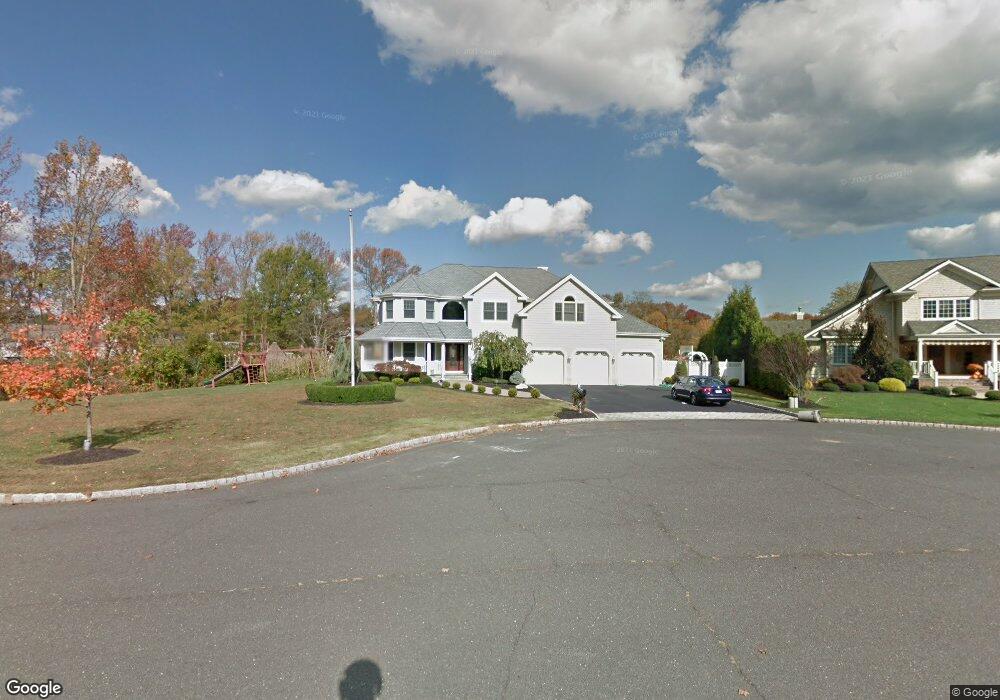
5 Fiore Ct Oceanport, NJ 07757
Estimated Value: $1,508,000 - $1,730,000
4
Beds
2
Baths
4,438
Sq Ft
$361/Sq Ft
Est. Value
About This Home
This home is located at 5 Fiore Ct, Oceanport, NJ 07757 and is currently estimated at $1,601,742, approximately $360 per square foot. 5 Fiore Ct is a home located in Monmouth County with nearby schools including Wolf Hill Elementary School, Maple Place Elementary and Middle School, and Shore Regional High School.
Ownership History
Date
Name
Owned For
Owner Type
Purchase Details
Closed on
Jul 2, 2008
Sold by
Fiore Robert P and Fiore Marcia H
Bought by
Fiore Robert P
Current Estimated Value
Home Financials for this Owner
Home Financials are based on the most recent Mortgage that was taken out on this home.
Original Mortgage
$625,000
Interest Rate
6.13%
Mortgage Type
New Conventional
Create a Home Valuation Report for This Property
The Home Valuation Report is an in-depth analysis detailing your home's value as well as a comparison with similar homes in the area
Home Values in the Area
Average Home Value in this Area
Purchase History
| Date | Buyer | Sale Price | Title Company |
|---|---|---|---|
| Fiore Robert P | -- | None Available |
Source: Public Records
Mortgage History
| Date | Status | Borrower | Loan Amount |
|---|---|---|---|
| Closed | Fiore Robert P | $625,000 |
Source: Public Records
Tax History
| Year | Tax Paid | Tax Assessment Tax Assessment Total Assessment is a certain percentage of the fair market value that is determined by local assessors to be the total taxable value of land and additions on the property. | Land | Improvement |
|---|---|---|---|---|
| 2025 | $17,311 | $1,150,000 | $356,200 | $793,800 |
| 2024 | $17,650 | $1,096,300 | $337,000 | $759,300 |
| 2023 | $17,650 | $1,060,700 | $330,700 | $730,000 |
| 2022 | $18,945 | $1,024,200 | $374,000 | $650,200 |
| 2021 | $18,945 | $994,500 | $368,900 | $625,600 |
| 2020 | $18,242 | $997,900 | $368,900 | $629,000 |
| 2019 | $17,700 | $982,800 | $368,900 | $613,900 |
| 2018 | $17,570 | $982,100 | $368,900 | $613,200 |
| 2017 | $17,269 | $800,600 | $255,600 | $545,000 |
| 2016 | $17,067 | $796,400 | $255,600 | $540,800 |
| 2015 | $16,351 | $788,400 | $255,600 | $532,800 |
| 2014 | $15,440 | $755,000 | $255,600 | $499,400 |
Source: Public Records
Map
Nearby Homes
- 448 Branchport Ave
- 66 Shrewsbury Ave
- 66 Seneca Place
- 68 Seneca Place
- 516 Atlantic Ave
- 428 Atlantic Ave
- 1 Foggia Way
- 11 Avon Ave
- 568 Shrewsbury Ave
- 265 Port Au Peck Ave
- 8 Pocahontas Ave
- 275 N 5th Ave
- 10 Asbury Ave
- 179 Edwards Ave
- 267 N 5th Ave
- 12 Balmer Ct
- 282 Rockwell Ave
- 35 Avon Ave
- 401 Joline Ave
- 28 Patten Ln
- 4 Fiore Ct
- 6 Fiore Ct
- 12 Comanche Dr
- 7 Fiore Ct
- 2 Shrewsbury Ave
- 6 Shrewsbury Ave
- 3 Fiore Ct
- 1 Fiore Ct
- 2 Fiore Ct
- 14 Comanche Dr
- 445 River St
- 449 River St
- 16 Comanche Dr
- 320 Port Au Peck Ave
- 331 Port Au Peck Ave
- 25 Vreeland Place
- 19 Werah Place
- 325 Port Au Peck Ave
- 335 Port Au Peck Ave
- 27 Vreeland Place
Your Personal Tour Guide
Ask me questions while you tour the home.