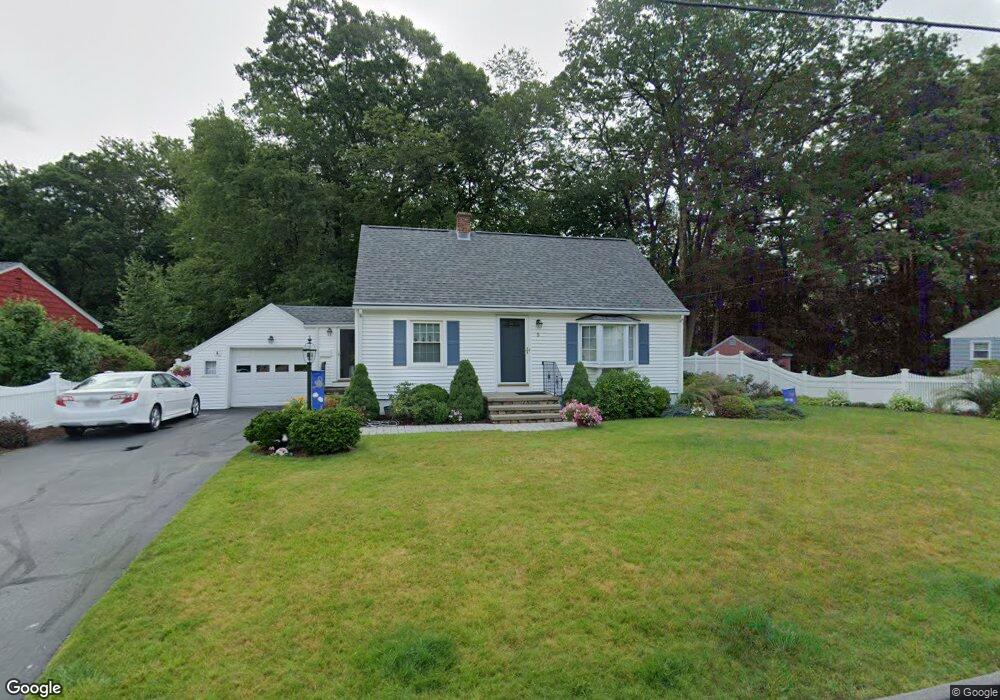
5 Fletcher Dr Auburn, MA 01501
Downtown Auburn NeighborhoodEstimated Value: $407,000 - $431,428
3
Beds
2
Baths
1,075
Sq Ft
$395/Sq Ft
Est. Value
About This Home
This home is located at 5 Fletcher Dr, Auburn, MA 01501 and is currently estimated at $424,107, approximately $394 per square foot. 5 Fletcher Dr is a home located in Worcester County with nearby schools including Auburn Senior High School and Shrewsbury Montessori School - Auburn Campus.
Ownership History
Date
Name
Owned For
Owner Type
Purchase Details
Closed on
May 9, 2013
Sold by
Corriveau Duane J and Corriveau Carolyn J
Bought by
Corriveau Ft and Leblanc Tracy L
Current Estimated Value
Purchase Details
Closed on
Sep 28, 1967
Bought by
Leblanc Tracy L and Corriveau Daryle J
Create a Home Valuation Report for This Property
The Home Valuation Report is an in-depth analysis detailing your home's value as well as a comparison with similar homes in the area
Home Values in the Area
Average Home Value in this Area
Purchase History
| Date | Buyer | Sale Price | Title Company |
|---|---|---|---|
| Corriveau Ft | -- | -- | |
| Leblanc Tracy L | -- | -- |
Source: Public Records
Mortgage History
| Date | Status | Borrower | Loan Amount |
|---|---|---|---|
| Previous Owner | Leblanc Tracy L | $67,293 | |
| Previous Owner | Leblanc Tracy L | $10,000 | |
| Previous Owner | Leblanc Tracy L | $75,000 | |
| Previous Owner | Leblanc Tracy L | $40,000 |
Source: Public Records
Tax History Compared to Growth
Tax History
| Year | Tax Paid | Tax Assessment Tax Assessment Total Assessment is a certain percentage of the fair market value that is determined by local assessors to be the total taxable value of land and additions on the property. | Land | Improvement |
|---|---|---|---|---|
| 2025 | $52 | $364,200 | $141,500 | $222,700 |
| 2024 | $5,125 | $343,300 | $136,200 | $207,100 |
| 2023 | $5,032 | $316,900 | $123,900 | $193,000 |
| 2022 | $4,760 | $283,000 | $123,900 | $159,100 |
| 2021 | $6,058 | $246,400 | $109,400 | $137,000 |
| 2020 | $4,333 | $241,000 | $109,400 | $131,600 |
| 2019 | $5,457 | $232,200 | $108,400 | $123,800 |
| 2018 | $3,488 | $218,300 | $101,400 | $116,900 |
| 2017 | $4,817 | $206,900 | $91,900 | $115,000 |
| 2016 | $3,614 | $199,800 | $94,800 | $105,000 |
| 2015 | $3,342 | $193,600 | $94,800 | $98,800 |
| 2014 | $3,263 | $188,700 | $90,100 | $98,600 |
Source: Public Records
Map
Nearby Homes