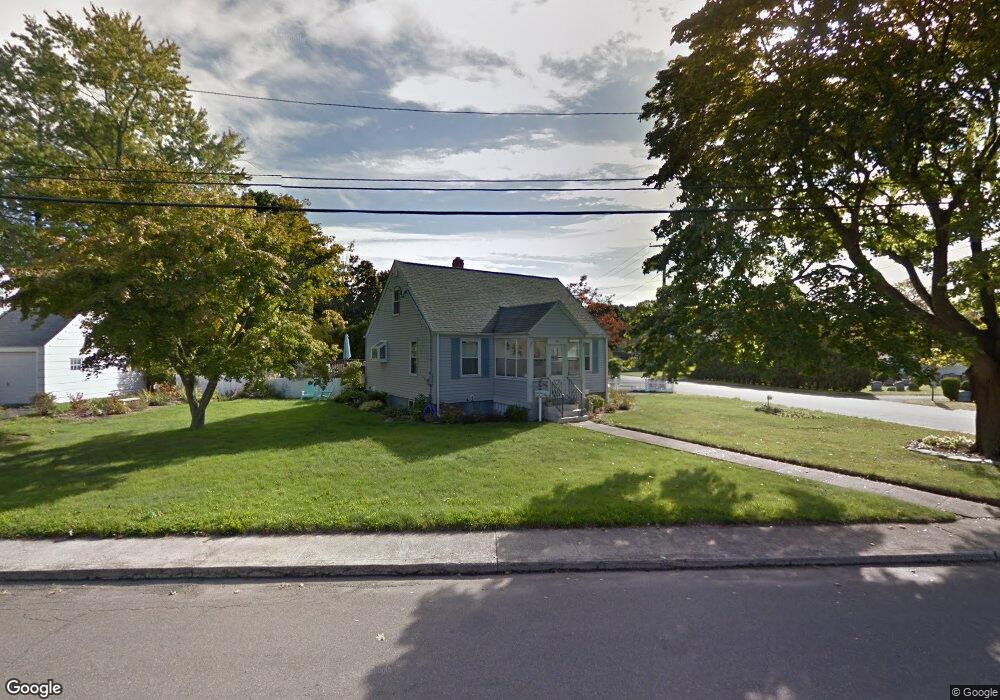
5 Foote Rd East Haven, CT 06512
Estimated Value: $319,263 - $377,000
3
Beds
1
Bath
1,008
Sq Ft
$341/Sq Ft
Est. Value
About This Home
This home is located at 5 Foote Rd, East Haven, CT 06512 and is currently estimated at $344,066, approximately $341 per square foot. 5 Foote Rd is a home located in New Haven County with nearby schools including East Haven High School, Elm City College Preparatory School, and St Mary School.
Ownership History
Date
Name
Owned For
Owner Type
Purchase Details
Closed on
Dec 1, 2005
Sold by
Mongillo Christina
Bought by
Quesnel Mary
Current Estimated Value
Home Financials for this Owner
Home Financials are based on the most recent Mortgage that was taken out on this home.
Original Mortgage
$198,000
Outstanding Balance
$109,793
Interest Rate
6.14%
Estimated Equity
$234,273
Purchase Details
Closed on
Aug 16, 2001
Sold by
Visconti James A and Visconti Sarah J
Bought by
Mongillo Christina
Purchase Details
Closed on
Jul 31, 1998
Sold by
Crotta Christopher P
Bought by
Visconti James A and Visconti Sarah J
Purchase Details
Closed on
May 7, 1990
Sold by
Burgh David J
Bought by
Crotta Christopher P
Purchase Details
Closed on
Apr 30, 1987
Sold by
Gleason Daniel J
Bought by
Burgh David J
Create a Home Valuation Report for This Property
The Home Valuation Report is an in-depth analysis detailing your home's value as well as a comparison with similar homes in the area
Home Values in the Area
Average Home Value in this Area
Purchase History
| Date | Buyer | Sale Price | Title Company |
|---|---|---|---|
| Quesnel Mary | $220,000 | -- | |
| Mongillo Christina | $152,000 | -- | |
| Visconti James A | $117,000 | -- | |
| Crotta Christopher P | $141,000 | -- | |
| Burgh David J | $130,000 | -- |
Source: Public Records
Mortgage History
| Date | Status | Borrower | Loan Amount |
|---|---|---|---|
| Open | Burgh David J | $350 | |
| Open | Burgh David J | $13,047 | |
| Open | Burgh David J | $198,000 |
Source: Public Records
Tax History Compared to Growth
Tax History
| Year | Tax Paid | Tax Assessment Tax Assessment Total Assessment is a certain percentage of the fair market value that is determined by local assessors to be the total taxable value of land and additions on the property. | Land | Improvement |
|---|---|---|---|---|
| 2025 | $4,499 | $134,540 | $47,810 | $86,730 |
| 2024 | $4,499 | $134,540 | $47,810 | $86,730 |
| 2023 | $4,198 | $134,540 | $47,810 | $86,730 |
| 2022 | $4,198 | $134,540 | $47,810 | $86,730 |
| 2021 | $3,814 | $111,360 | $45,680 | $65,680 |
| 2020 | $3,814 | $111,360 | $45,680 | $65,680 |
| 2019 | $3,610 | $111,360 | $45,680 | $65,680 |
| 2018 | $3,614 | $111,360 | $45,680 | $65,680 |
| 2017 | $3,513 | $111,360 | $45,680 | $65,680 |
| 2016 | $3,444 | $109,160 | $45,680 | $63,480 |
| 2015 | $3,444 | $109,160 | $45,680 | $63,480 |
| 2014 | $3,499 | $109,160 | $45,680 | $63,480 |
Source: Public Records
Map
Nearby Homes
- 34 River St
- 49 Foote Rd
- 58 Edward St
- 102 Vista Dr
- 39 High St
- 2 Kirkham Ave
- 26 Vista Dr
- 71 High St
- 48 Bishop St
- 30 Bradley Ave
- 312 Monticello Dr
- 51 Francis St
- 330 Short Beach Rd Unit H8
- 330 Short Beach Rd Unit B9
- 271 Monticello Dr
- 17 Guilford Ct
- 192 Monticello Dr Unit 192
- 107 Kenneth St Unit B
- 83 Hudson St
- 117 Kenneth St Unit B