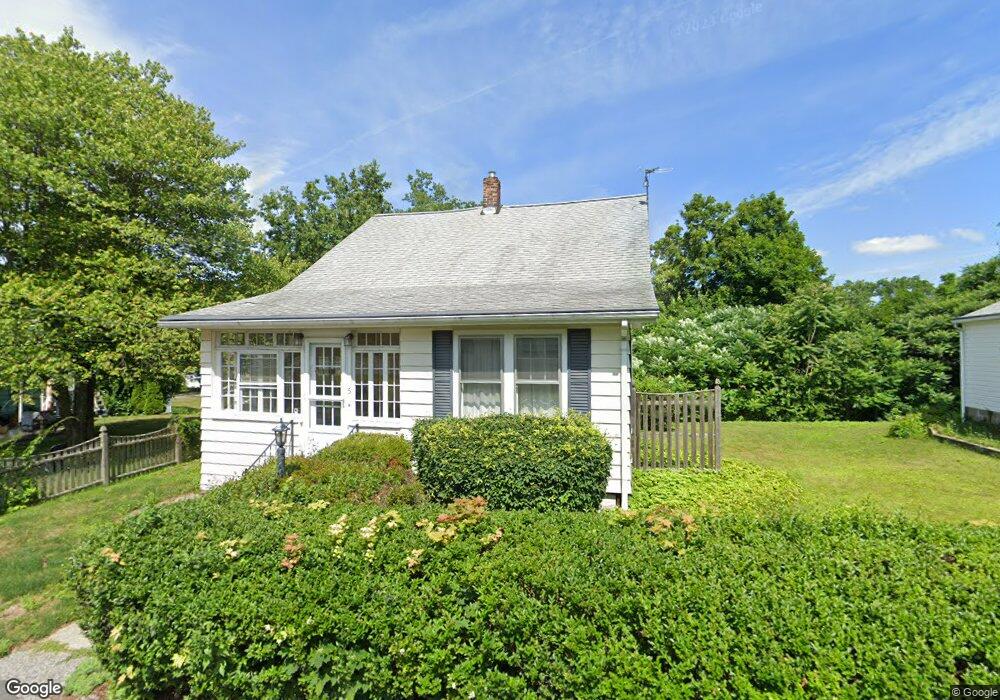
5 Forest Dr Auburn, MA 01501
Stoneville NeighborhoodEstimated Value: $367,000 - $472,000
3
Beds
1
Bath
1,588
Sq Ft
$267/Sq Ft
Est. Value
About This Home
This home is located at 5 Forest Dr, Auburn, MA 01501 and is currently estimated at $424,218, approximately $267 per square foot. 5 Forest Dr is a home located in Worcester County with nearby schools including Auburn Senior High School, Canterbury Street School, and Shrewsbury Montessori School - Auburn Campus.
Ownership History
Date
Name
Owned For
Owner Type
Purchase Details
Closed on
Aug 28, 2008
Sold by
Szklarz Marion J and Szklarz Robert S
Bought by
Shea Garry J
Current Estimated Value
Home Financials for this Owner
Home Financials are based on the most recent Mortgage that was taken out on this home.
Original Mortgage
$196,650
Outstanding Balance
$129,351
Interest Rate
6.29%
Mortgage Type
Purchase Money Mortgage
Estimated Equity
$294,867
Create a Home Valuation Report for This Property
The Home Valuation Report is an in-depth analysis detailing your home's value as well as a comparison with similar homes in the area
Home Values in the Area
Average Home Value in this Area
Purchase History
| Date | Buyer | Sale Price | Title Company |
|---|---|---|---|
| Shea Garry J | $207,000 | -- |
Source: Public Records
Mortgage History
| Date | Status | Borrower | Loan Amount |
|---|---|---|---|
| Open | Shea Garry J | $196,650 |
Source: Public Records
Tax History
| Year | Tax Paid | Tax Assessment Tax Assessment Total Assessment is a certain percentage of the fair market value that is determined by local assessors to be the total taxable value of land and additions on the property. | Land | Improvement |
|---|---|---|---|---|
| 2025 | $44 | $304,400 | $108,800 | $195,600 |
| 2024 | $4,231 | $283,400 | $103,500 | $179,900 |
| 2023 | $4,164 | $262,200 | $94,100 | $168,100 |
| 2022 | $3,931 | $233,700 | $94,100 | $139,600 |
| 2021 | $3,555 | $196,000 | $83,000 | $113,000 |
| 2020 | $15,006 | $191,700 | $83,000 | $108,700 |
| 2019 | $3,343 | $181,500 | $77,800 | $103,700 |
| 2018 | $14,048 | $170,600 | $72,800 | $97,800 |
| 2017 | $2,975 | $162,200 | $66,000 | $96,200 |
| 2016 | $2,909 | $160,800 | $69,300 | $91,500 |
| 2015 | $2,753 | $159,500 | $69,300 | $90,200 |
| 2014 | $2,690 | $155,600 | $66,000 | $89,600 |
Source: Public Records
Map
Nearby Homes
- 61 Sumner St
- 5 Commonwealth Ave
- 18 Carroll St
- 177 Boyce St
- 25 Vinal St Unit 28
- 25 Vinal St Unit 26
- 25 Vinal St Unit 29
- 25 Vinal St Unit 30
- 34 Preston Ave
- 1 Rockland Road Ct
- 1034 Southbridge St
- 204-212 Hampton St
- 10 Hulbert Rd Unit 10
- 11 Hulbert Rd Unit 13
- 154 Pakachoag St
- 35 Hampton St
- 5 Clarendon Rd
- 177 Oxford St N
- 103 Henshaw St
- 401 Forest Park Dr
Your Personal Tour Guide
Ask me questions while you tour the home.