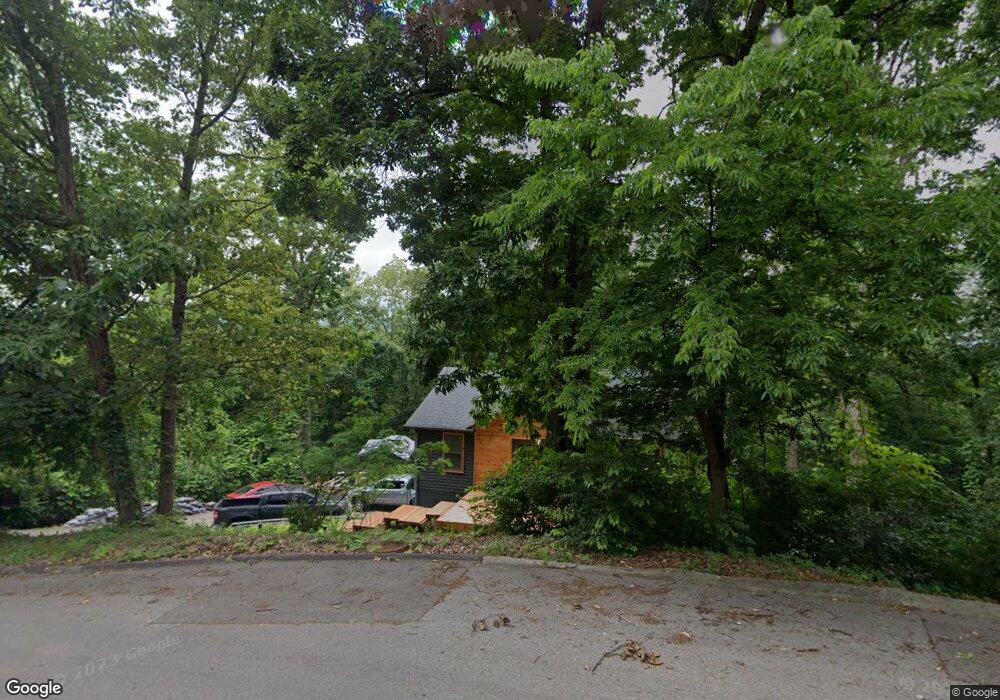
5 Fox Chase St Unit LT 9B Rossville, GA 30741
Estimated Value: $204,000 - $244,000
3
Beds
2
Baths
1,120
Sq Ft
$201/Sq Ft
Est. Value
About This Home
This home is located at 5 Fox Chase St Unit LT 9B, Rossville, GA 30741 and is currently estimated at $224,779, approximately $200 per square foot. 5 Fox Chase St Unit LT 9B is a home located in Walker County with nearby schools including Rossville Elementary School, Rossville Middle School, and Ridgeland High School.
Ownership History
Date
Name
Owned For
Owner Type
Purchase Details
Closed on
Feb 15, 2021
Sold by
Hicks Michael J
Bought by
Taraba Jason and Taraba Toni
Current Estimated Value
Purchase Details
Closed on
Dec 28, 2017
Sold by
M Tac Properties Llc
Bought by
Hicks Michael
Home Financials for this Owner
Home Financials are based on the most recent Mortgage that was taken out on this home.
Original Mortgage
$60,000
Interest Rate
3.9%
Mortgage Type
Unknown
Purchase Details
Closed on
Oct 17, 2016
Bought by
M Tac Properties Llc
Home Financials for this Owner
Home Financials are based on the most recent Mortgage that was taken out on this home.
Original Mortgage
$55,000
Interest Rate
3.5%
Mortgage Type
New Conventional
Purchase Details
Closed on
Apr 7, 2015
Sold by
Crowder Ken
Bought by
Us Bank National Association T
Purchase Details
Closed on
Mar 31, 2008
Sold by
Not Provided
Bought by
Crowder Ken and Jillian Crowder
Purchase Details
Closed on
Jan 11, 2007
Sold by
Not Provided
Bought by
Crowder Ken and Jillian Crowder
Create a Home Valuation Report for This Property
The Home Valuation Report is an in-depth analysis detailing your home's value as well as a comparison with similar homes in the area
Home Values in the Area
Average Home Value in this Area
Purchase History
| Date | Buyer | Sale Price | Title Company |
|---|---|---|---|
| Taraba Jason | $119,000 | -- | |
| Hicks Michael | -- | -- | |
| M Tac Properties Llc | $55,000 | -- | |
| Us Bank National Association T | $84,000 | -- | |
| Crowder Ken | $100,000 | -- | |
| Crowder Ken | $17,000 | -- |
Source: Public Records
Mortgage History
| Date | Status | Borrower | Loan Amount |
|---|---|---|---|
| Previous Owner | Hicks Michael | $60,000 | |
| Previous Owner | M Tac Properties Llc | $55,000 |
Source: Public Records
Tax History Compared to Growth
Tax History
| Year | Tax Paid | Tax Assessment Tax Assessment Total Assessment is a certain percentage of the fair market value that is determined by local assessors to be the total taxable value of land and additions on the property. | Land | Improvement |
|---|---|---|---|---|
| 2024 | $2,799 | $85,724 | $7,856 | $77,868 |
| 2023 | $2,742 | $83,059 | $7,856 | $75,203 |
| 2022 | $1,253 | $69,848 | $7,856 | $61,992 |
| 2021 | $1,073 | $36,552 | $5,237 | $31,315 |
| 2020 | $923 | $30,077 | $5,237 | $24,840 |
| 2019 | $923 | $30,077 | $5,237 | $24,840 |
| 2018 | $895 | $30,077 | $5,237 | $24,840 |
| 2017 | $1,000 | $30,077 | $5,237 | $24,840 |
| 2016 | $829 | $30,077 | $5,237 | $24,840 |
| 2015 | $959 | $35,124 | $5,000 | $30,124 |
| 2014 | $923 | $35,124 | $5,000 | $30,124 |
| 2013 | -- | $35,124 | $5,000 | $30,124 |
Source: Public Records
Map
Nearby Homes
- 189 Leinbach Rd
- 0 Dempsey Ln Unit 1504691
- 115 Beech St
- 39 Clift Trail
- 141 Hogan Rd
- 301 Dempsey Ln
- 806 Mcfarland Ave
- 0 S Mission Ridge Dr Unit 1504695
- 405 Miami Ave
- 127 Summitt St
- 136 Summit St
- Lot 81 Battle Bluff Dr
- Lot 80 Battle Bluff Dr
- Lot 79 Battle Bluff Dr
- 71 Georgia Terrace
- 0 Summit St Unit 1514634
- 1204 Wooden Ave
- 916 Logan Ave
- 5 Fox Chase St
- 7 Fox Chase St
- 710 Bronson St
- 712 Bronson St
- 9 Fox Chase St
- 9 Fox Chase St Unit LT 9C
- 9 Fox Chase St Unit C
- 9 Fox Chase St Unit B
- 714 Bronson St
- 10 Fox Chase St
- 0 Fox Chase St
- 3 Fox Chase St
- 716 Bronson St
- 11 Fox Chase St
- 0 Bronson St Unit 8298333
- 0 Bronson St
- 6 Fox Chase St
- 718 Bronson St
- 12 Fox Chase St
- 0 Hickory St Unit 8502114