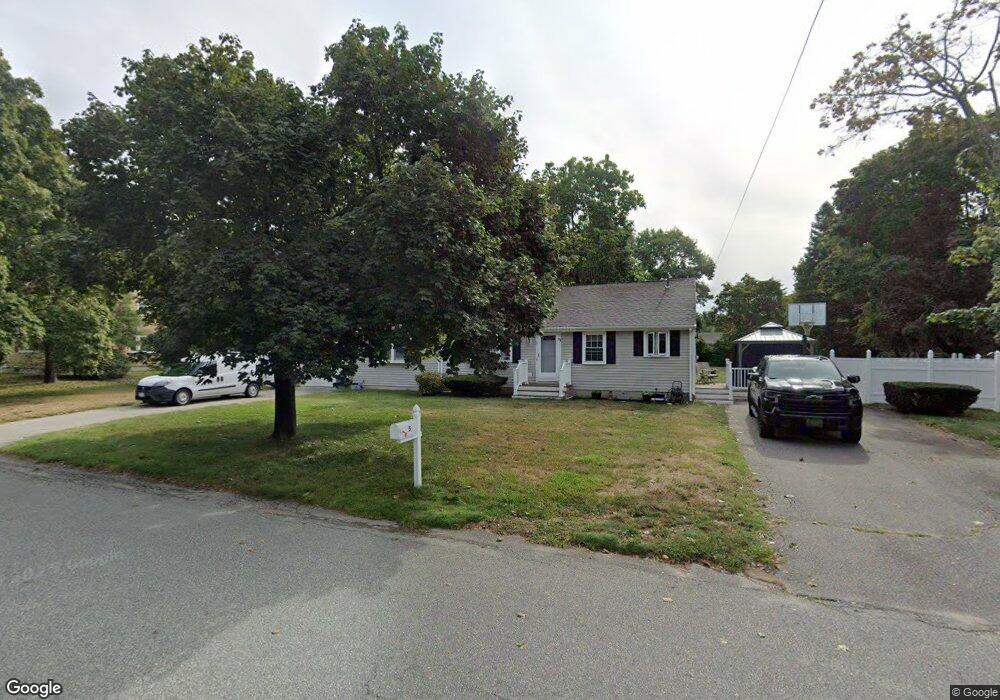
5 Franklin Rd Hanover, MA 02339
Estimated Value: $556,146 - $597,000
3
Beds
2
Baths
1,320
Sq Ft
$440/Sq Ft
Est. Value
About This Home
This home is located at 5 Franklin Rd, Hanover, MA 02339 and is currently estimated at $581,037, approximately $440 per square foot. 5 Franklin Rd is a home located in Plymouth County with nearby schools including Hanover High School and Calvary Chapel Academy.
Ownership History
Date
Name
Owned For
Owner Type
Purchase Details
Closed on
Sep 3, 2024
Sold by
Sullivan Patrick J and Sullivan Rita L
Bought by
J P
Current Estimated Value
Purchase Details
Closed on
Dec 16, 1991
Sold by
Groezinger John J and Groezinger Kathleen
Bought by
Sullivan Patrick J and Sullivan Rita L
Create a Home Valuation Report for This Property
The Home Valuation Report is an in-depth analysis detailing your home's value as well as a comparison with similar homes in the area
Home Values in the Area
Average Home Value in this Area
Purchase History
| Date | Buyer | Sale Price | Title Company |
|---|---|---|---|
| J P | -- | None Available | |
| J P | -- | None Available | |
| J P | -- | None Available | |
| Sullivan Patrick J | $133,100 | -- | |
| Sullivan Patrick J | $133,100 | -- |
Source: Public Records
Mortgage History
| Date | Status | Borrower | Loan Amount |
|---|---|---|---|
| Previous Owner | Sullivan Patrick J | $166,000 | |
| Previous Owner | Sullivan Patrick J | $120,000 | |
| Previous Owner | Sullivan Patrick J | $30,000 |
Source: Public Records
Tax History
| Year | Tax Paid | Tax Assessment Tax Assessment Total Assessment is a certain percentage of the fair market value that is determined by local assessors to be the total taxable value of land and additions on the property. | Land | Improvement |
|---|---|---|---|---|
| 2025 | $5,633 | $456,100 | $210,800 | $245,300 |
| 2024 | $5,856 | $456,100 | $210,800 | $245,300 |
| 2023 | $5,872 | $435,300 | $191,700 | $243,600 |
| 2022 | $6,184 | $405,500 | $215,700 | $189,800 |
| 2021 | $4,390 | $382,100 | $185,200 | $196,900 |
| 2020 | $4,289 | $355,100 | $174,300 | $180,800 |
| 2019 | $5,151 | $313,900 | $152,500 | $161,400 |
| 2018 | $5,265 | $323,400 | $170,000 | $153,400 |
| 2017 | $5,295 | $320,500 | $158,900 | $161,600 |
| 2016 | $5,260 | $312,000 | $159,000 | $153,000 |
| 2015 | $5,039 | $312,000 | $159,000 | $153,000 |
Source: Public Records
Map
Nearby Homes
- 823 Market St
- 561 Circuit St
- 75 School St
- 36 Bayberry Ln
- 9 Old Market St
- 47 Stone Meadow Ln
- 696 Summer St
- 44 Stone Meadow Ln
- 506 Main St
- 49 Liberty St
- 92 Liberty St
- 117 Liberty St
- 776 Main St
- 95 Tecumseh Dr
- 810 Brookline Way
- 8 Pat Rose Way
- 436 E Water St
- 5 Pat Rose Way
- 9 Pat Rose Way
- 62 Larchmont Ln
Your Personal Tour Guide
Ask me questions while you tour the home.