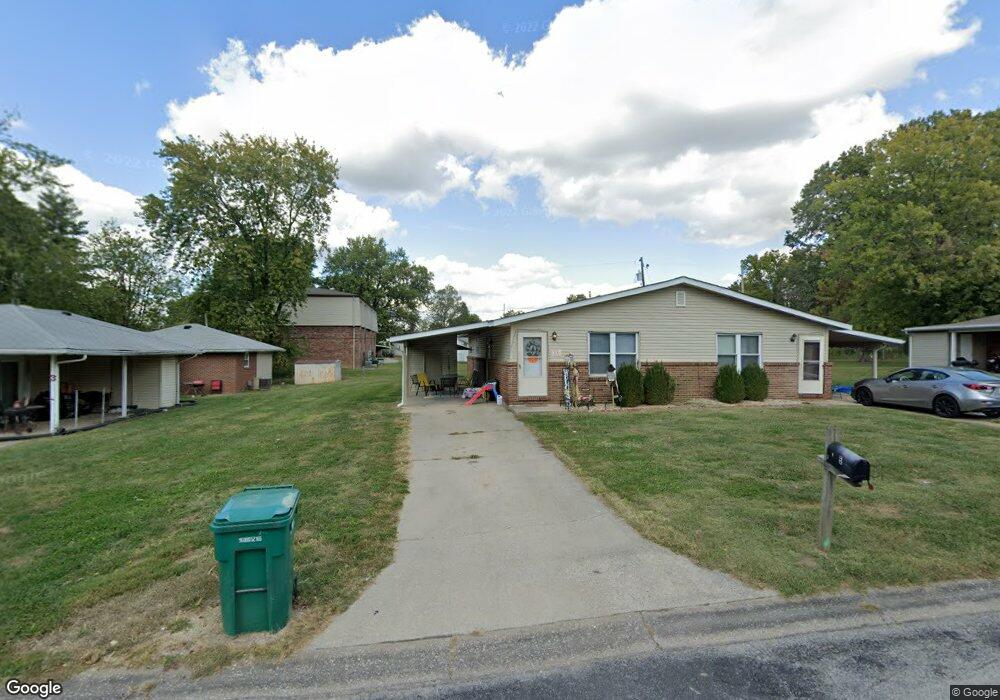
5 Friendship Dr Belleville, IL 62226
Estimated Value: $136,000 - $160,000
Studio
--
Bath
1,900
Sq Ft
$80/Sq Ft
Est. Value
About This Home
This home is located at 5 Friendship Dr, Belleville, IL 62226 and is currently estimated at $151,575, approximately $79 per square foot. 5 Friendship Dr is a home located in St. Clair County with nearby schools including Union Elementary School, West Jr High School, and Our Lady Queen Of Peace Catholic School.
Ownership History
Date
Name
Owned For
Owner Type
Purchase Details
Closed on
Oct 15, 2020
Sold by
Rouse Properties Llc
Bought by
Schaefer Homes Llc
Current Estimated Value
Home Financials for this Owner
Home Financials are based on the most recent Mortgage that was taken out on this home.
Original Mortgage
$1,328,000
Outstanding Balance
$1,168,172
Interest Rate
2.8%
Mortgage Type
Commercial
Estimated Equity
-$1,016,597
Purchase Details
Closed on
Oct 12, 2009
Sold by
Luzmoor Kathleen E
Bought by
Bouse Properties Llc
Purchase Details
Closed on
Oct 8, 2009
Sold by
Associated Bank National Association
Bought by
Luzmoor Kathleen E
Purchase Details
Closed on
Jun 25, 2009
Sold by
Luzmoor Kathleen E
Bought by
Associated Bank
Purchase Details
Closed on
Jul 7, 2006
Sold by
Lester James M and Laferte Susan L
Bought by
Luzmoor Kathleen E
Create a Home Valuation Report for This Property
The Home Valuation Report is an in-depth analysis detailing your home's value as well as a comparison with similar homes in the area
Home Values in the Area
Average Home Value in this Area
Purchase History
| Date | Buyer | Sale Price | Title Company |
|---|---|---|---|
| Schaefer Homes Llc | $1,660,000 | Accoooooooooooooooooooooooo | |
| Bouse Properties Llc | $40,000 | Fatic | |
| Luzmoor Kathleen E | -- | First American Title Ins | |
| Associated Bank | -- | None Available | |
| Luzmoor Kathleen E | -- | None Available |
Source: Public Records
Mortgage History
| Date | Status | Borrower | Loan Amount |
|---|---|---|---|
| Open | Schaefer Homes Llc | $1,328,000 |
Source: Public Records
Tax History
| Year | Tax Paid | Tax Assessment Tax Assessment Total Assessment is a certain percentage of the fair market value that is determined by local assessors to be the total taxable value of land and additions on the property. | Land | Improvement |
|---|---|---|---|---|
| 2024 | $3,132 | $42,098 | $7,217 | $34,881 |
| 2023 | $2,713 | $34,394 | $7,117 | $27,277 |
| 2022 | $2,533 | $31,324 | $6,482 | $24,842 |
| 2021 | $2,504 | $30,038 | $6,216 | $23,822 |
| 2020 | $2,425 | $27,974 | $5,789 | $22,185 |
| 2019 | $2,248 | $26,568 | $6,020 | $20,548 |
| 2018 | $2,211 | $25,889 | $5,866 | $20,023 |
| 2017 | $2,172 | $25,200 | $5,710 | $19,490 |
| 2016 | $2,178 | $24,331 | $5,513 | $18,818 |
| 2014 | $1,270 | $32,001 | $6,607 | $25,394 |
| 2013 | $1,379 | $32,001 | $6,607 | $25,394 |
Source: Public Records
Map
Nearby Homes
- 22 Kensington Heights Rd Unit 22 & 24
- 128 Freedom Dr
- 22 Elizabeth Dr
- 112 Freedom Dr
- 3311 S Belt W
- 2819 Frank Scott Pkwy W
- 4521 N Belt W
- 4101 W Main St
- 5 Parkridge
- 6 Parkridge Unit 6
- 109 S 38th St
- 19 N 40th St
- 129 N 44th St
- 3816 W Main St
- 102 N 41st St
- 108 S 37th St
- 126 N 44th St
- 2264 Frank Scott Pkwy W
- 140 S 35th St
- 2241 Frank Scott Pkwy W
- 7 Friendship Dr
- 160 Freedom Dr
- 164 Freedom Dr
- 9 Friendship Dr
- 193 Liberty Dr Unit 2
- 193 Liberty Dr
- 193 Liberty Dr Unit 193 & 195
- 2 Friendship Dr
- 6 Friendship Dr
- 10 Friendship Dr
- 152 Freedom Dr
- 177 Liberty Dr
- 161 Freedom Dr
- 13 Friendship Dr
- 157 Freedom Dr
- 206 Liberty Dr
- 14 Friendship Dr
- 204 Liberty Dr
- 200 Liberty 202 Dr
- 200202 Liberty Dr
Your Personal Tour Guide
Ask me questions while you tour the home.