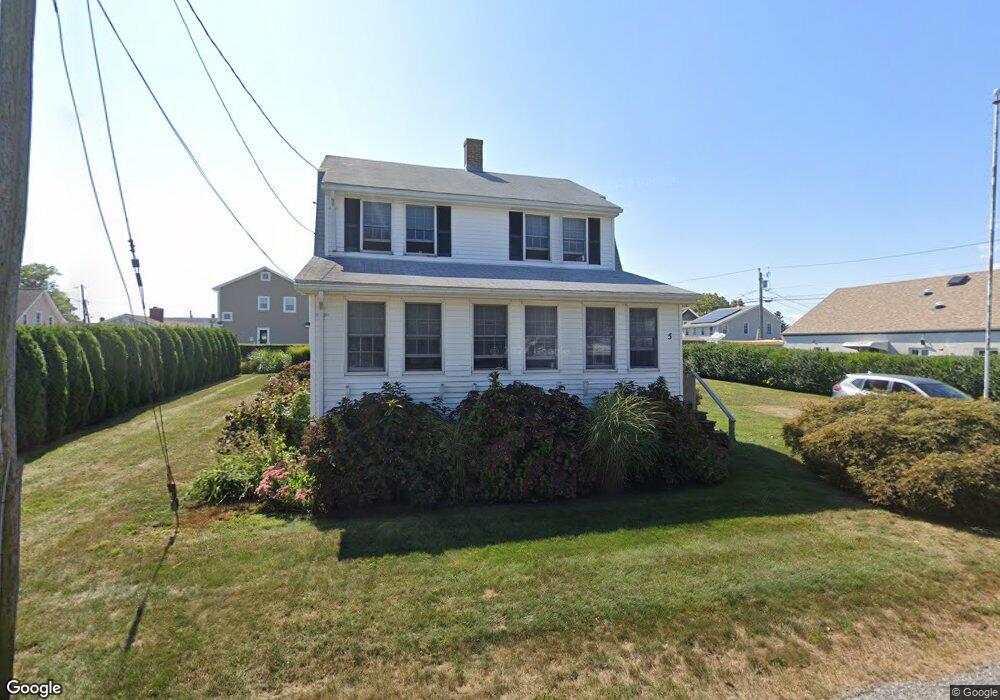
5 Gates Rd Old Saybrook, CT 06475
Estimated Value: $640,000 - $900,000
4
Beds
2
Baths
1,368
Sq Ft
$564/Sq Ft
Est. Value
About This Home
This home is located at 5 Gates Rd, Old Saybrook, CT 06475 and is currently estimated at $771,221, approximately $563 per square foot. 5 Gates Rd is a home located in Middlesex County with nearby schools including Kathleen E. Goodwin School, Old Saybrook Middle School, and Old Saybrook Senior High School.
Ownership History
Date
Name
Owned For
Owner Type
Purchase Details
Closed on
Dec 27, 2021
Sold by
Dornfried William H and Stepeck Laura
Bought by
Stepeck Dornfired Family
Current Estimated Value
Purchase Details
Closed on
Mar 5, 2021
Sold by
Dornfried Children T
Bought by
Dornfried William and Stepeck Maura
Purchase Details
Closed on
Sep 21, 1987
Sold by
Dully Thomas E
Bought by
Dornfield Frances D
Create a Home Valuation Report for This Property
The Home Valuation Report is an in-depth analysis detailing your home's value as well as a comparison with similar homes in the area
Home Values in the Area
Average Home Value in this Area
Purchase History
| Date | Buyer | Sale Price | Title Company |
|---|---|---|---|
| Stepeck Dornfired Family | -- | None Available | |
| Dornfried William | -- | None Available | |
| Dornfield Frances D | $215,000 | -- |
Source: Public Records
Mortgage History
| Date | Status | Borrower | Loan Amount |
|---|---|---|---|
| Previous Owner | Dornfield Frances D | $120,000 |
Source: Public Records
Tax History
| Year | Tax Paid | Tax Assessment Tax Assessment Total Assessment is a certain percentage of the fair market value that is determined by local assessors to be the total taxable value of land and additions on the property. | Land | Improvement |
|---|---|---|---|---|
| 2025 | $6,019 | $388,300 | $202,900 | $185,400 |
| 2024 | $5,902 | $388,300 | $202,900 | $185,400 |
| 2023 | $5,321 | $260,200 | $137,800 | $122,400 |
| 2022 | $5,225 | $260,200 | $137,800 | $122,400 |
| 2021 | $5,217 | $260,200 | $137,800 | $122,400 |
| 2020 | $5,217 | $260,200 | $137,800 | $122,400 |
| 2019 | $5,139 | $260,200 | $137,800 | $122,400 |
| 2018 | $5,216 | $266,100 | $137,800 | $128,300 |
| 2017 | $5,232 | $266,100 | $137,800 | $128,300 |
| 2016 | $5,125 | $266,100 | $137,800 | $128,300 |
| 2015 | $5,005 | $266,100 | $137,800 | $128,300 |
| 2014 | $4,923 | $266,100 | $137,800 | $128,300 |
Source: Public Records
Map
Nearby Homes
- 24 W Shore Dr
- 10 Edwards Rd
- 372 Maple Ave
- 1 Beamon Meadow Place
- 73 Knollwood Dr
- 104 Knollwood Dr
- 105 Fenwood Dr
- 33 Fenwood Rd
- 11 S View Terrace
- 23 Clinton Ave
- 41 Farview Ave
- 39 Middletown Ave
- 2 Pequot Trail
- 367 Main St Unit 7
- 25 Sunset Rd Unit 7
- 18 Quarry St
- 60 Ingham Hill Rd
- 2 Old South Cove Rd
- 1333 Boston Post Rd Unit 1
- 13 College St
Your Personal Tour Guide
Ask me questions while you tour the home.