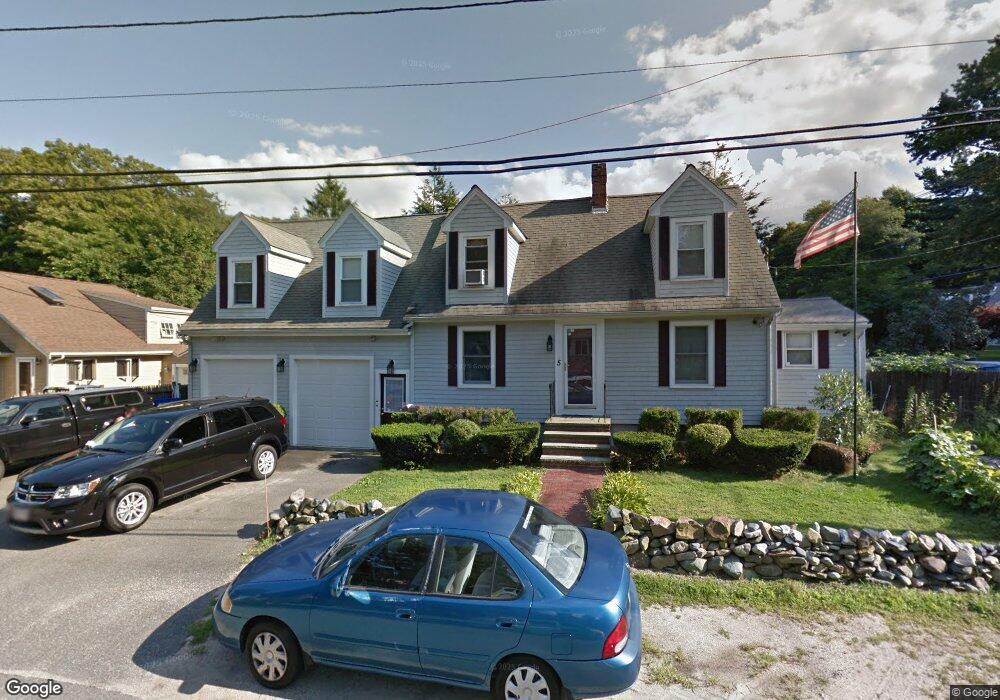
5 Glendale St Weymouth, MA 02188
Weymouth Landing NeighborhoodEstimated Value: $678,000 - $969,000
4
Beds
4
Baths
2,862
Sq Ft
$287/Sq Ft
Est. Value
About This Home
This home is located at 5 Glendale St, Weymouth, MA 02188 and is currently estimated at $822,707, approximately $287 per square foot. 5 Glendale St is a home located in Norfolk County with nearby schools including Frederick C Murphy, Abigail Adams Middle School, and Weymouth Middle School Chapman.
Ownership History
Date
Name
Owned For
Owner Type
Purchase Details
Closed on
Feb 7, 2007
Sold by
Harvey Karen L and Harvey Wayne L
Bought by
Hunt Elizabeth A and Harvey Karen L
Current Estimated Value
Purchase Details
Closed on
Jul 28, 1995
Sold by
Norton Rita M
Bought by
Harvey Karen L and Harvey Wayne L
Home Financials for this Owner
Home Financials are based on the most recent Mortgage that was taken out on this home.
Original Mortgage
$111,600
Interest Rate
7.56%
Mortgage Type
Purchase Money Mortgage
Create a Home Valuation Report for This Property
The Home Valuation Report is an in-depth analysis detailing your home's value as well as a comparison with similar homes in the area
Home Values in the Area
Average Home Value in this Area
Purchase History
| Date | Buyer | Sale Price | Title Company |
|---|---|---|---|
| Hunt Elizabeth A | $186,000 | -- | |
| Harvey Karen L | $117,500 | -- |
Source: Public Records
Mortgage History
| Date | Status | Borrower | Loan Amount |
|---|---|---|---|
| Previous Owner | Harvey Karen L | $120,000 | |
| Previous Owner | Harvey Karen L | $111,600 | |
| Previous Owner | Harvey Karen L | $2,450 | |
| Previous Owner | Harvey Karen L | $1,000 |
Source: Public Records
Tax History Compared to Growth
Tax History
| Year | Tax Paid | Tax Assessment Tax Assessment Total Assessment is a certain percentage of the fair market value that is determined by local assessors to be the total taxable value of land and additions on the property. | Land | Improvement |
|---|---|---|---|---|
| 2025 | $7,983 | $790,400 | $216,600 | $573,800 |
| 2024 | $7,733 | $753,000 | $206,300 | $546,700 |
| 2023 | $7,364 | $704,700 | $191,000 | $513,700 |
| 2022 | $7,111 | $620,500 | $176,900 | $443,600 |
| 2021 | $6,749 | $574,900 | $176,900 | $398,000 |
| 2020 | $6,566 | $550,800 | $176,900 | $373,900 |
| 2019 | $6,402 | $528,200 | $170,100 | $358,100 |
| 2018 | $6,230 | $498,400 | $162,000 | $336,400 |
| 2017 | $5,777 | $451,000 | $154,300 | $296,700 |
| 2016 | $5,608 | $438,100 | $148,300 | $289,800 |
| 2015 | $5,334 | $413,500 | $141,600 | $271,900 |
| 2014 | $5,005 | $376,300 | $131,800 | $244,500 |
Source: Public Records
Map
Nearby Homes
- 114 Broad St Unit D
- 114 Broad St Unit C
- 19 Vine St Unit 3
- 19 Vine St Unit 1
- 11 Richmond St
- 23-25 Lindbergh Ave
- 122 Washington St Unit 22
- 16 Lindbergh Ave
- 294 Commercial St
- 286 Broad St
- 12 Klasson Ln
- 36 Brookside Rd
- 76 Kingman St
- 15 Summer St
- 367 Essex St
- 33 Congress St
- 15 1st St
- 286 Essex St
- 38 Idlewell St
- 141 Commercial St Unit 9