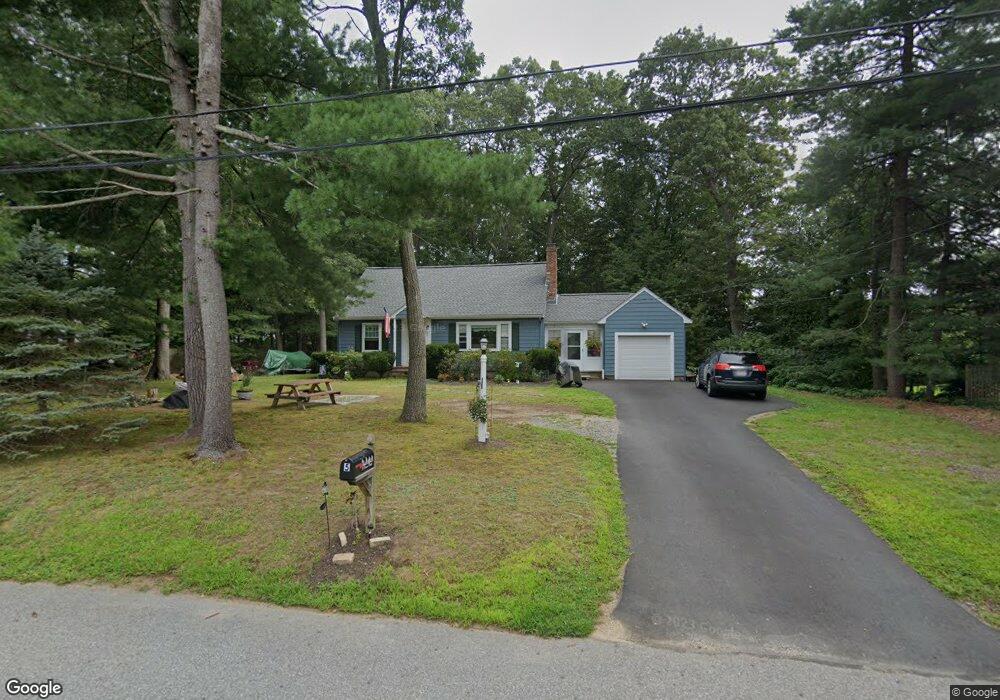
5 Grace Rd Wayland, MA 01778
Estimated Value: $731,000 - $937,000
2
Beds
1
Bath
936
Sq Ft
$906/Sq Ft
Est. Value
About This Home
This home is located at 5 Grace Rd, Wayland, MA 01778 and is currently estimated at $847,943, approximately $905 per square foot. 5 Grace Rd is a home located in Middlesex County with nearby schools including Wayland High School and Veritas Christian Academy.
Ownership History
Date
Name
Owned For
Owner Type
Purchase Details
Closed on
Jun 10, 2025
Sold by
Ramsey Paul A and Breuning Cornelia A
Bought by
Grace Road Rt and Breuning
Current Estimated Value
Purchase Details
Closed on
Sep 2, 2003
Sold by
Trask Inc
Bought by
Finelli Building Inc
Home Financials for this Owner
Home Financials are based on the most recent Mortgage that was taken out on this home.
Original Mortgage
$600,000
Interest Rate
5.69%
Mortgage Type
Purchase Money Mortgage
Purchase Details
Closed on
Dec 8, 1992
Sold by
Hart Nancy H Est
Bought by
Ramsey Paul A and Breuning Cornelia
Home Financials for this Owner
Home Financials are based on the most recent Mortgage that was taken out on this home.
Original Mortgage
$110,000
Interest Rate
8.22%
Mortgage Type
Purchase Money Mortgage
Create a Home Valuation Report for This Property
The Home Valuation Report is an in-depth analysis detailing your home's value as well as a comparison with similar homes in the area
Home Values in the Area
Average Home Value in this Area
Purchase History
| Date | Buyer | Sale Price | Title Company |
|---|---|---|---|
| Grace Road Rt | -- | None Available | |
| Grace Road Rt | -- | None Available | |
| Finelli Building Inc | $325,000 | -- | |
| Finelli Building Inc | $325,000 | -- | |
| Ramsey Paul A | $147,000 | -- |
Source: Public Records
Mortgage History
| Date | Status | Borrower | Loan Amount |
|---|---|---|---|
| Previous Owner | Ramsey Paul A | $225,000 | |
| Previous Owner | Finelli Building Inc | $600,000 | |
| Previous Owner | Ramsey Paul A | $110,000 |
Source: Public Records
Tax History Compared to Growth
Tax History
| Year | Tax Paid | Tax Assessment Tax Assessment Total Assessment is a certain percentage of the fair market value that is determined by local assessors to be the total taxable value of land and additions on the property. | Land | Improvement |
|---|---|---|---|---|
| 2025 | $12,778 | $817,500 | $557,500 | $260,000 |
| 2024 | $12,081 | $778,400 | $531,100 | $247,300 |
| 2023 | $11,732 | $704,600 | $482,800 | $221,800 |
| 2022 | $10,982 | $598,500 | $399,600 | $198,900 |
| 2021 | $10,412 | $562,200 | $363,300 | $198,900 |
| 2020 | $9,985 | $562,200 | $363,300 | $198,900 |
| 2019 | $9,613 | $525,900 | $346,100 | $179,800 |
| 2018 | $9,163 | $508,200 | $346,100 | $162,100 |
| 2017 | $8,876 | $489,300 | $329,700 | $159,600 |
| 2016 | $8,132 | $469,000 | $323,300 | $145,700 |
| 2015 | $8,218 | $446,900 | $323,300 | $123,600 |
Source: Public Records
Map
Nearby Homes
- 37 Pemberton Rd
- 15 Parkridge Rd
- 177 Main St
- 233 Lakeshore Dr
- 62 E Plain St
- 3 Keith Rd
- 123 Dudley Rd
- 9 French Ave
- 108 Dudley Rd
- 15 Crest Rd
- 26 Dudley Rd
- 454 Old Connecticut Path
- 96 Lake Shore Dr
- 96 Lakeshore Dr
- 22 Magnolia Rd
- 18 Magnolia Rd
- 36 Brownlea Rd
- 22 Lakeshore Dr
- 39 Evergreen Rd
- 192 School St